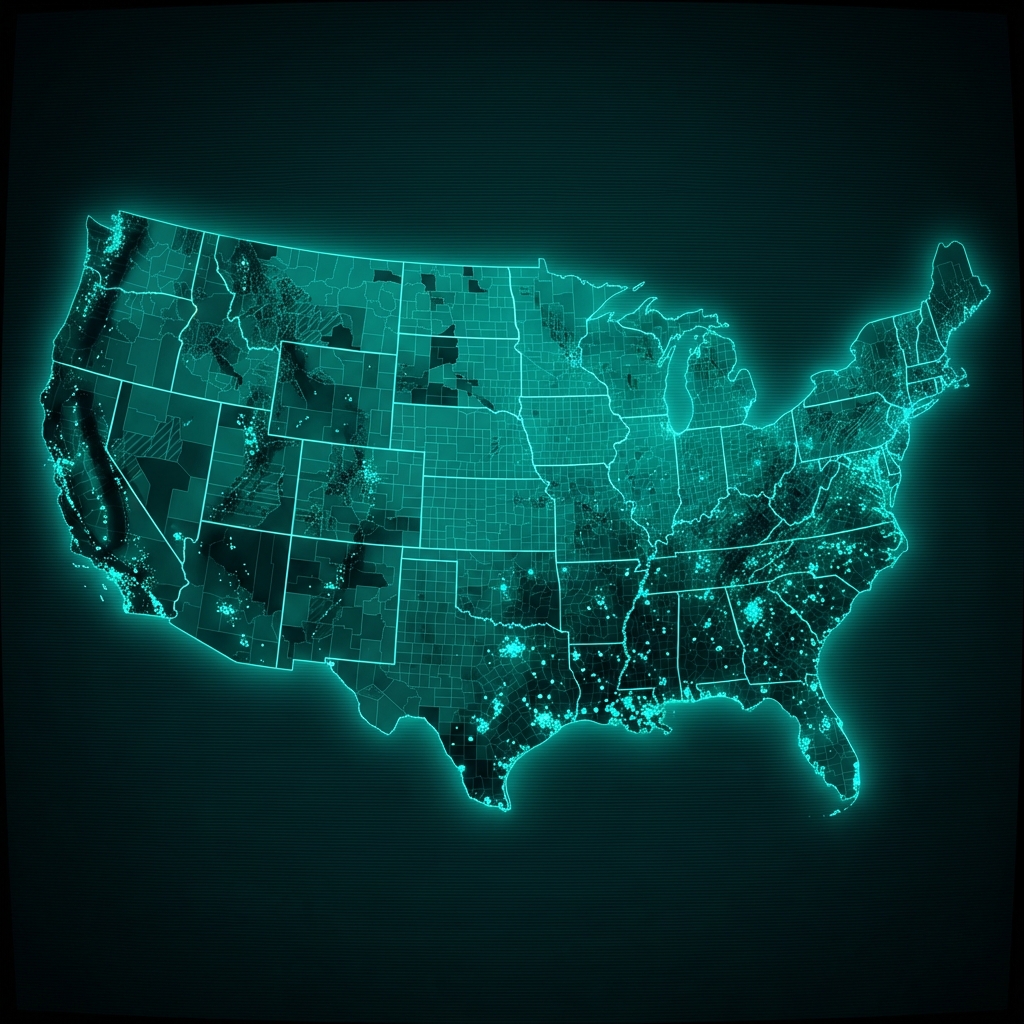
Contiguous U.S. Cyanobacteria Extent
MERIS and OLCI satellite data with CI_cyano algorithm quantify the spatial extent of cyanobacteria. Werdell. Satellites quantify the spatial extent of cyanobacterial blooms across the United States at multiple scales. ECOLOGICAL INDICATORS. Elsevier Science Ltd, New York, NY, USA, 140: 108990, (2022). Maintained by the U.S. Environmental Protection Agency.
| Namelegal entity | Cityaddress | Stateaddress | ZIP Codeaddress | Street Addressaddress | Emailwebsite | Phonephone number | @Sync | Arcgisformatclassification | Arcgisstyleclassification | Charsetcd.@Sync | Charsetcd.@Value |
|---|---|---|---|---|---|---|---|---|---|---|---|
| ESRI | Redlands | California | 92373-8100 | 380 New York Street | info@esri.com | 9097932853 |
Water Utility Supply Risk Screening
A water utility procurement team evaluating surface water sources checks which lakes and reservoirs fall within documented cyanobacteria bloom extents to assess treatment cost risk and potential service disruptions before signing long-term supply contracts.
Environmental Liability Underwriting for Lakefront Properties
A commercial property insurer assessing policies on lakefront industrial or agricultural facilities cross-references bloom spatial extent data against property locations to estimate regulatory exposure and potential remediation liability before setting premiums.
Aquaculture Vendor Due Diligence
A food supply chain analyst vetting aquaculture suppliers checks whether a vendor's water source falls within historically documented bloom zones to flag contamination risk and determine whether additional water quality certifications should be required.
 Natural Hazard Vulnerability and RCRA Site LocationsU.S. Environmental Protection Agency
 30x30 Conserved Areas, TerrestrialState of California
 Crop Rotation LiteratureU.S. Environmental Protection Agency
 EPA Integrated Compliance Information System: Air FacilitiesU.S. Environmental Protection Agency
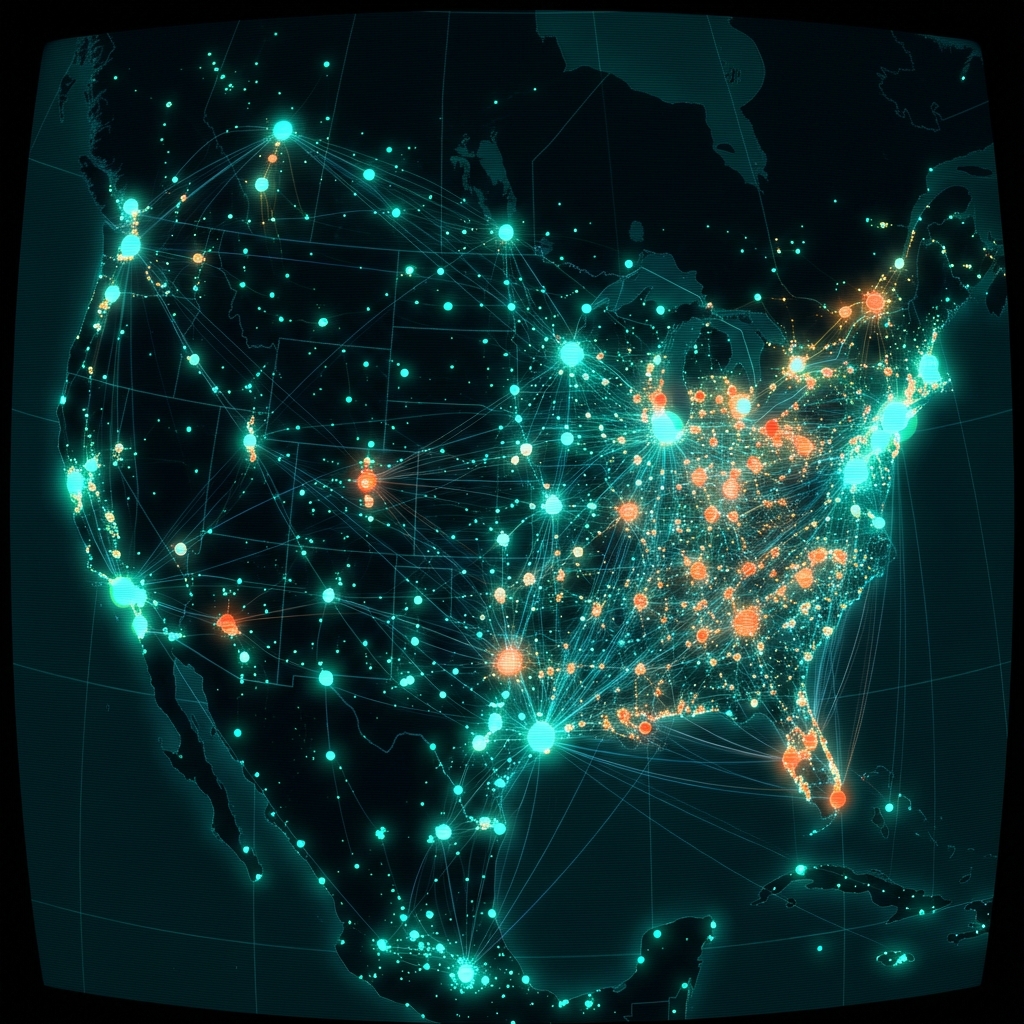 EPA Enforcement and Compliance History Online: FacilitiesU.S. Environmental Protection Agency
 Brownfields SitesU.S. Environmental Protection Agency
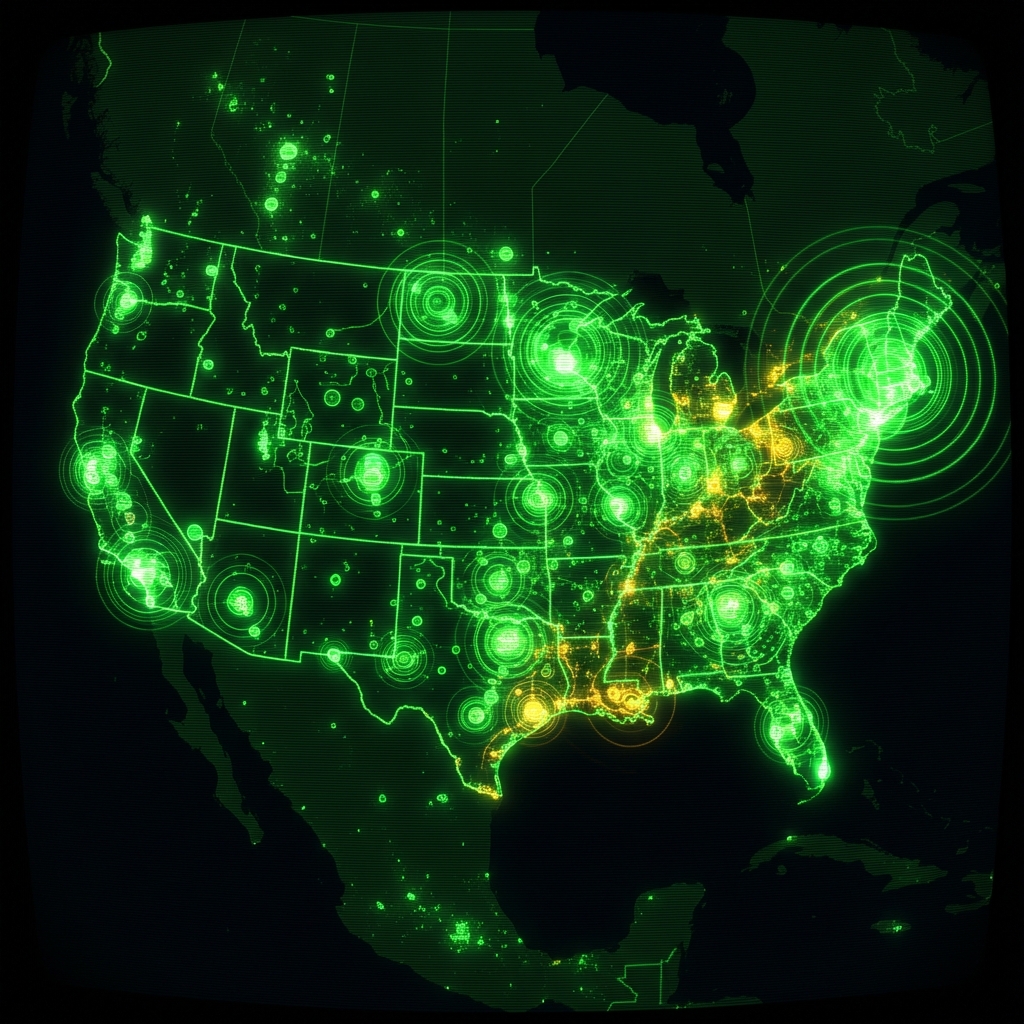 Demand Response Across the Continental USDepartment of Energy
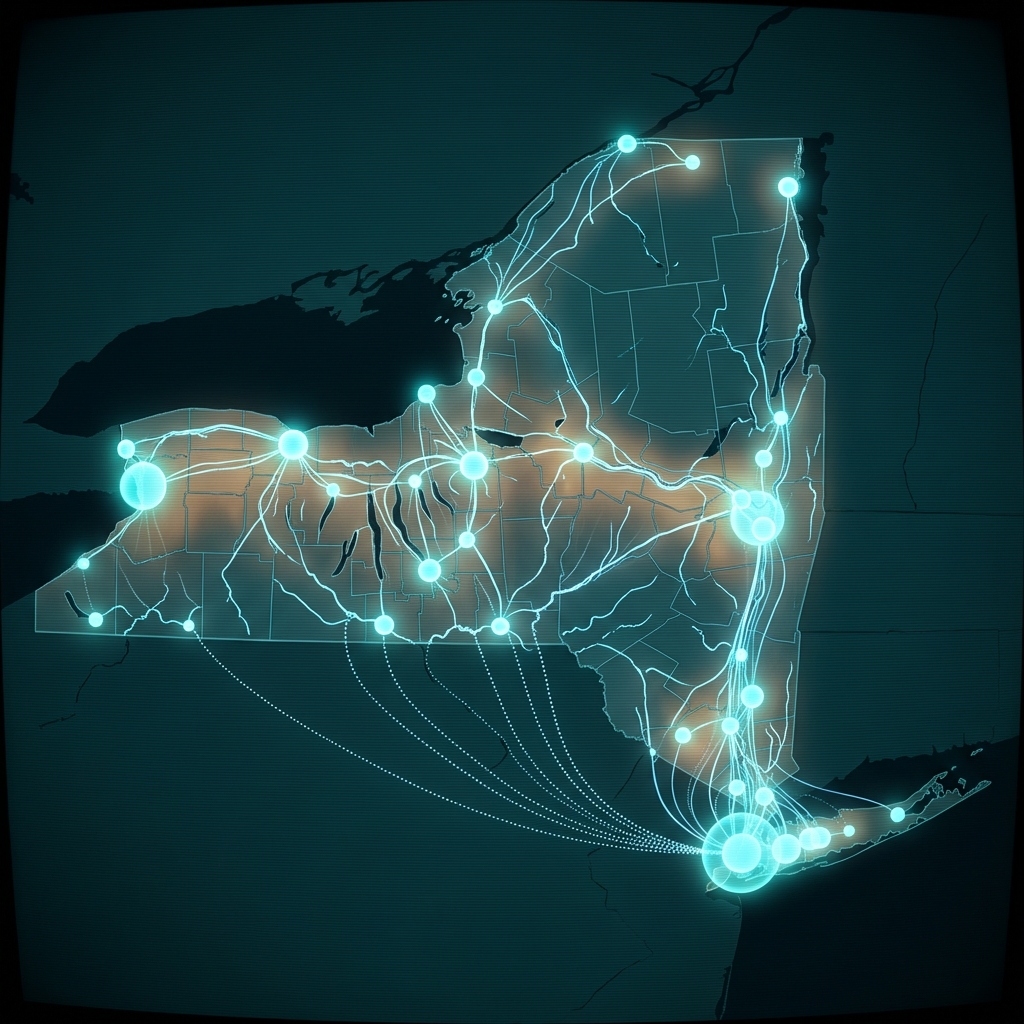 Water Withdrawals by Facility (2009-Present)State of New York
 EPA Facility Registry: National Priorities ListU.S. Environmental Protection Agency
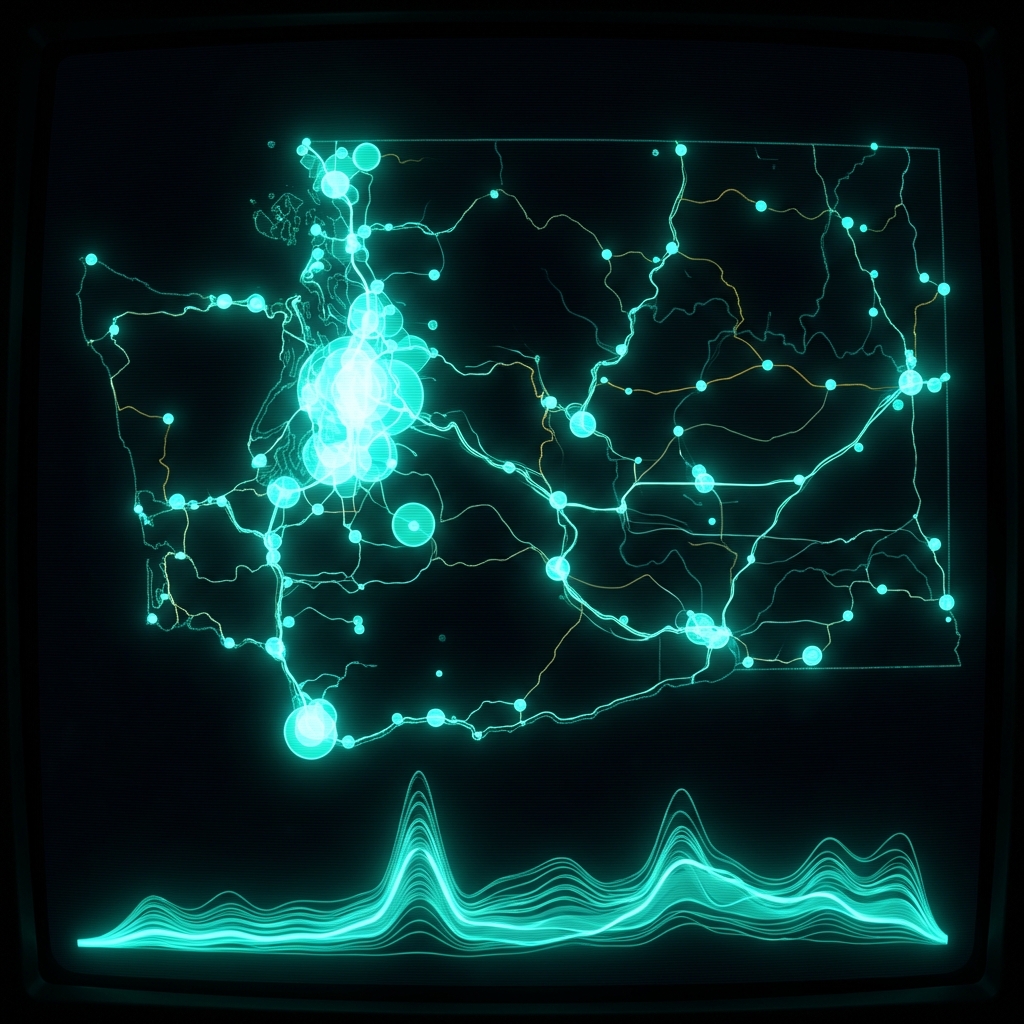 State Environmental Policy Act RegisterState of Washington
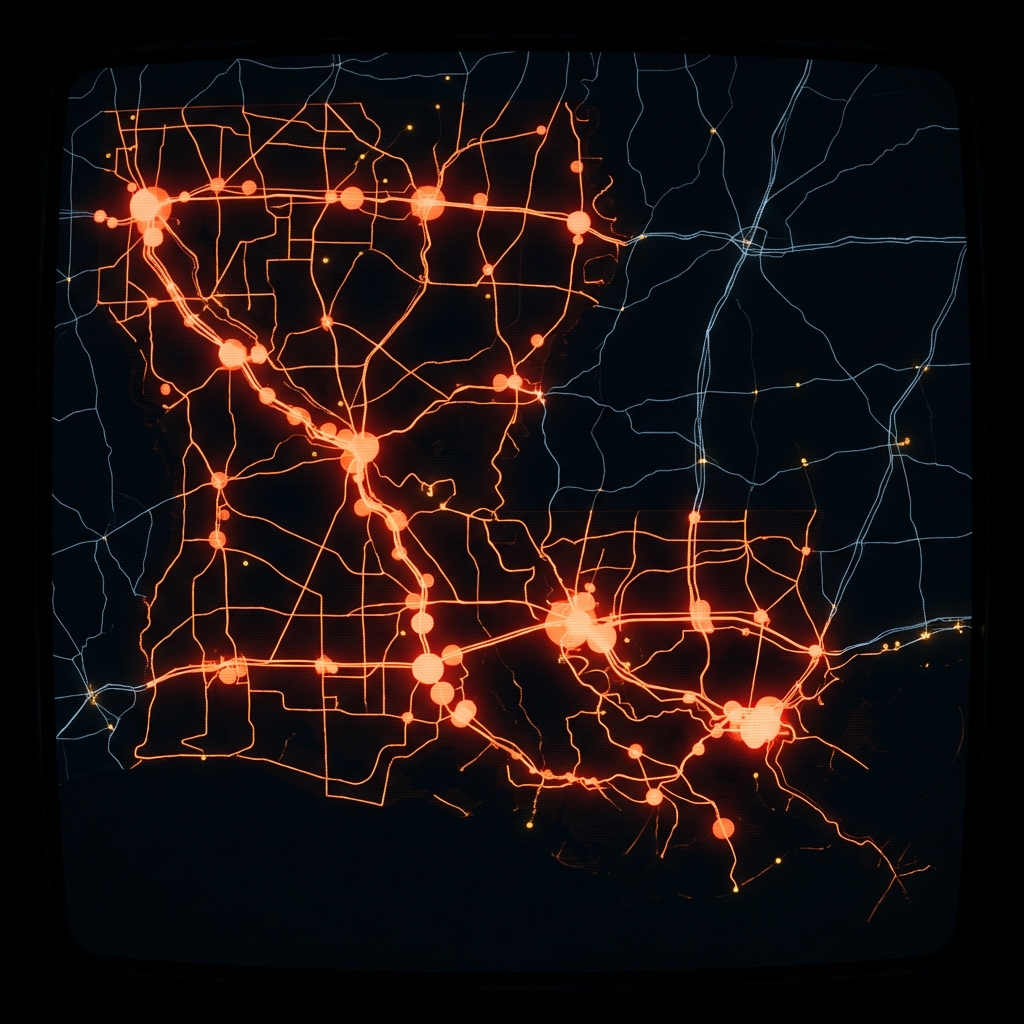 EPA Enforcement and Compliance History Online: Hazardous Waste Sites Data SetU.S. Environmental Protection Agency
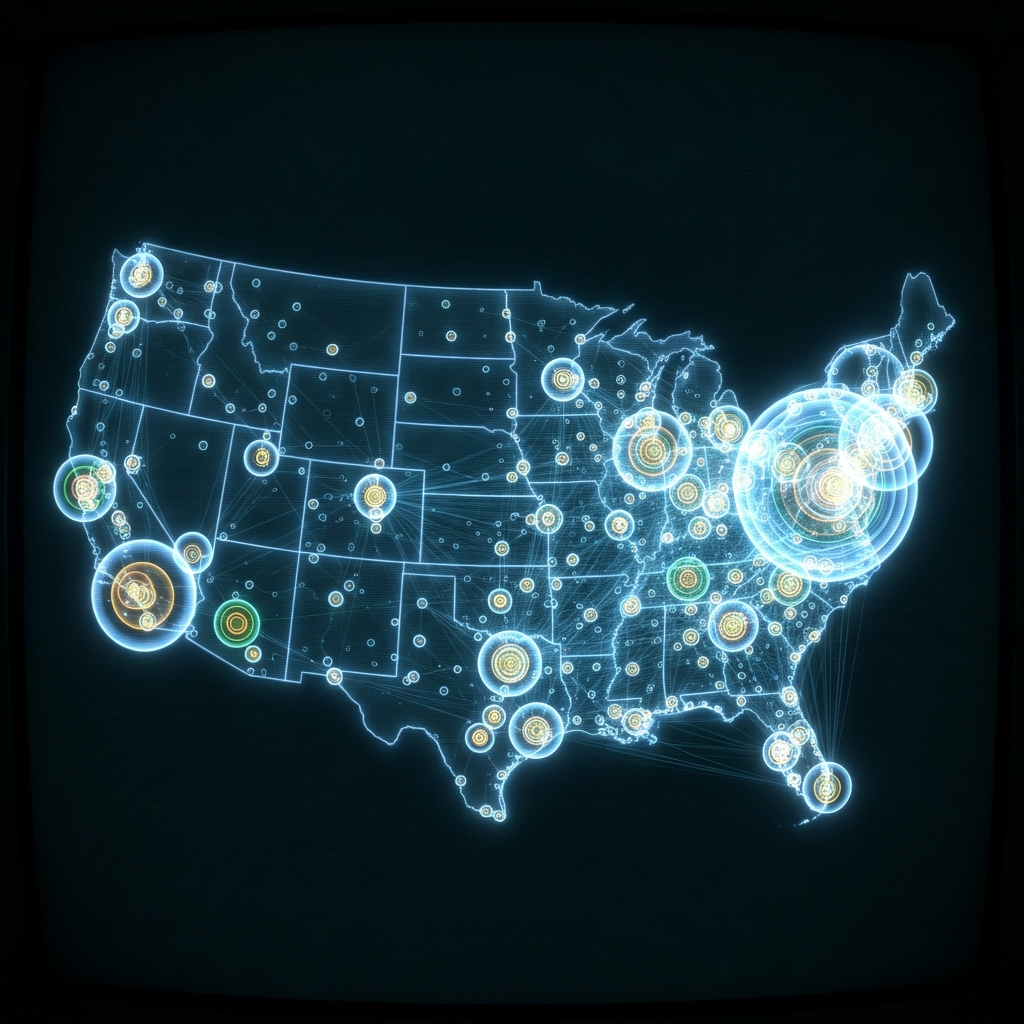 Real Estate Across the United States (REXUS Leases)General Services Administration
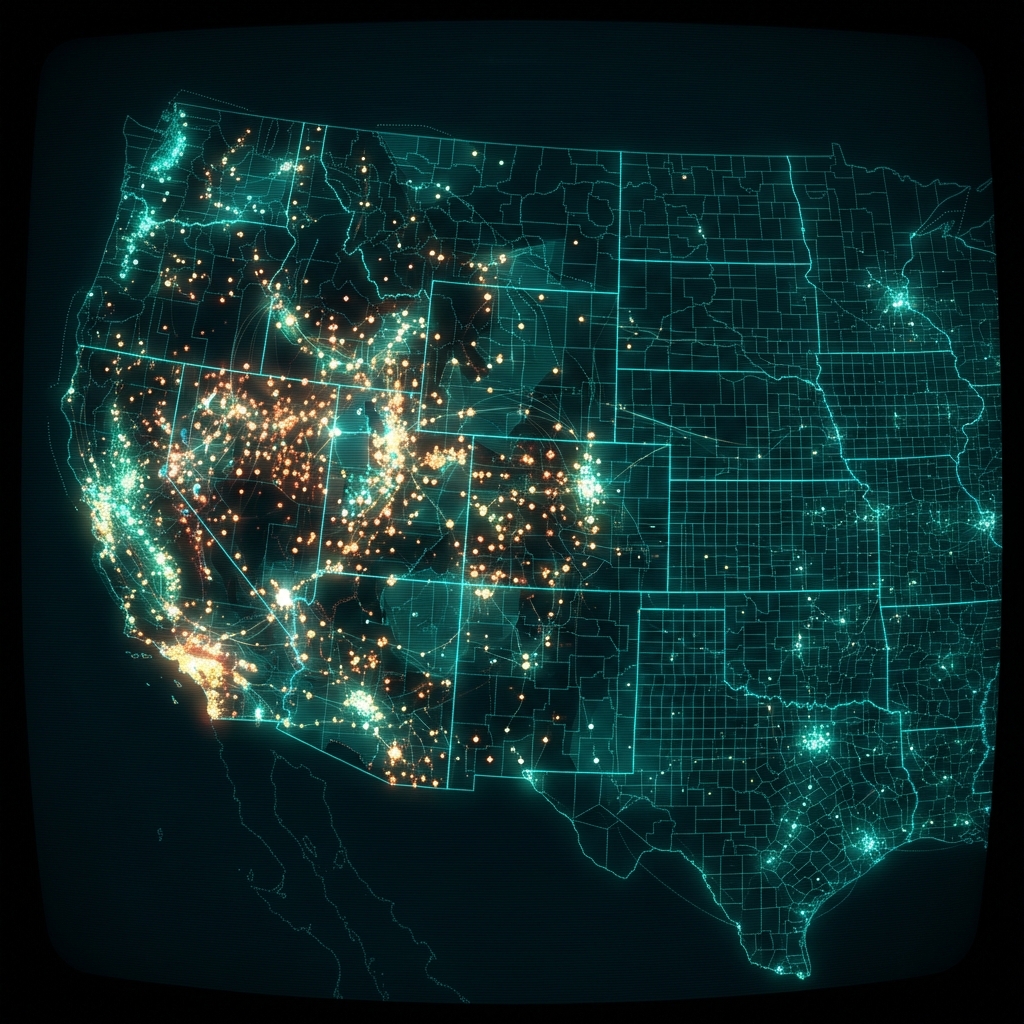 BLM Locatable Mineral Plans of OperationsDepartment of the Interior
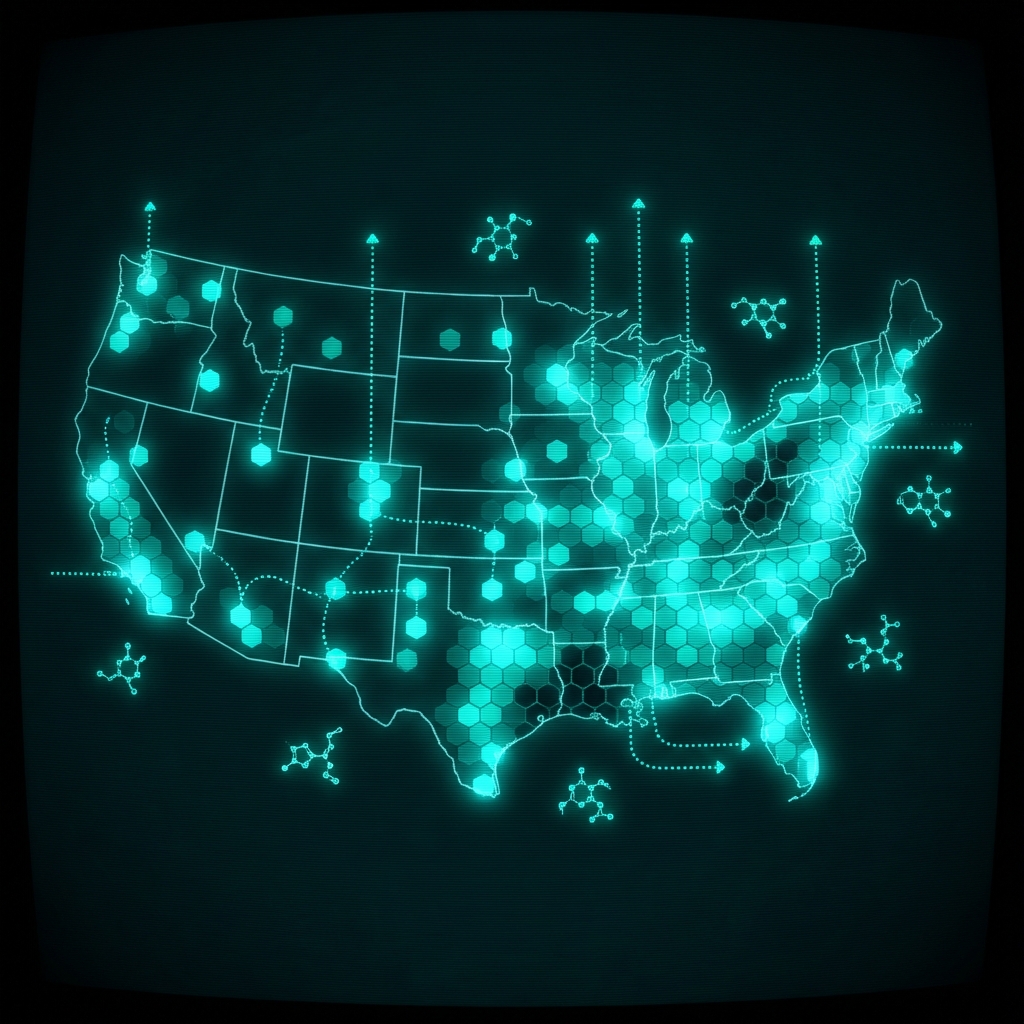 Toxics Release InventoryU.S. Environmental Protection Agency
 Environmental Review Project MilestonesCity of New York
 Places of Use - FishState of Oregon
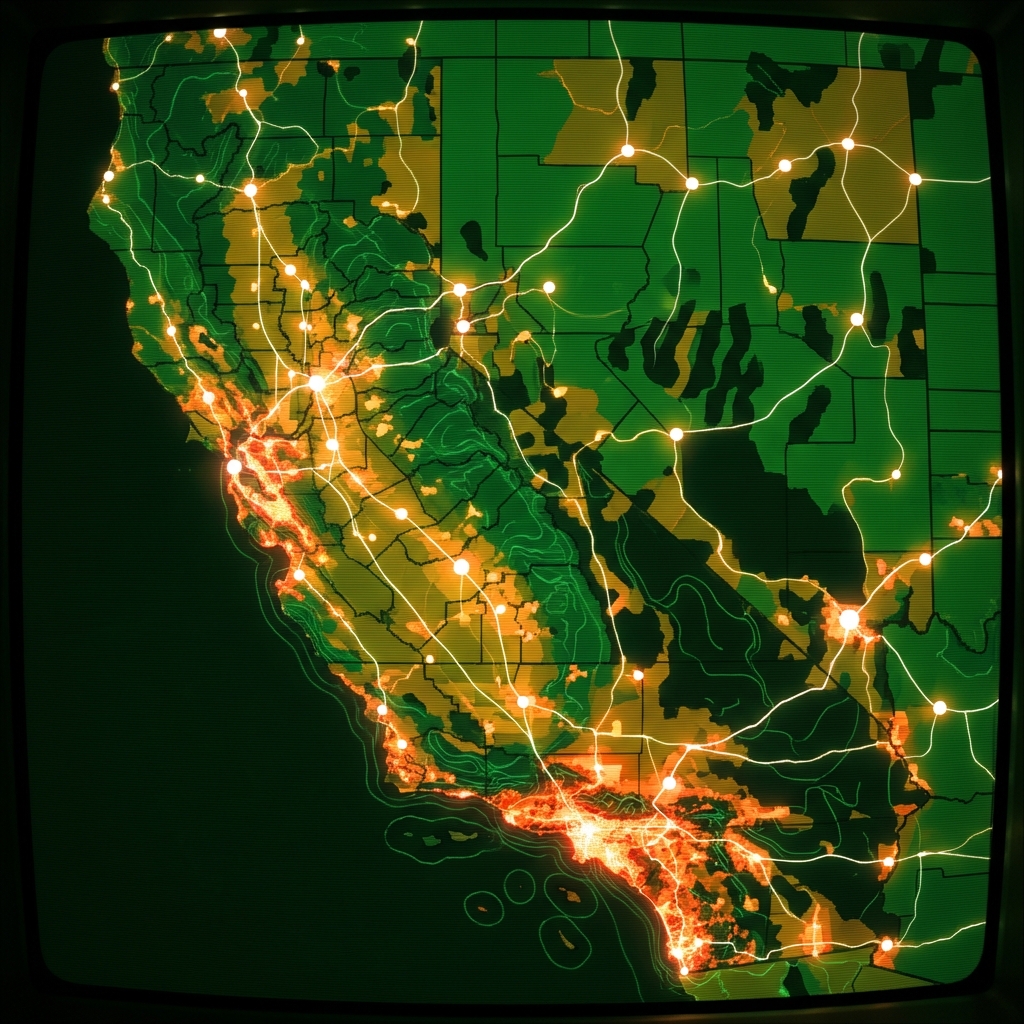 Draft Terrestrial Landscape Intactness for 2026-2027 Integrated Resource PlanState of California
 EPA Facility Registry: Biennial ReportersU.S. Environmental Protection Agency
 Environmental Remediation SitesState of New York
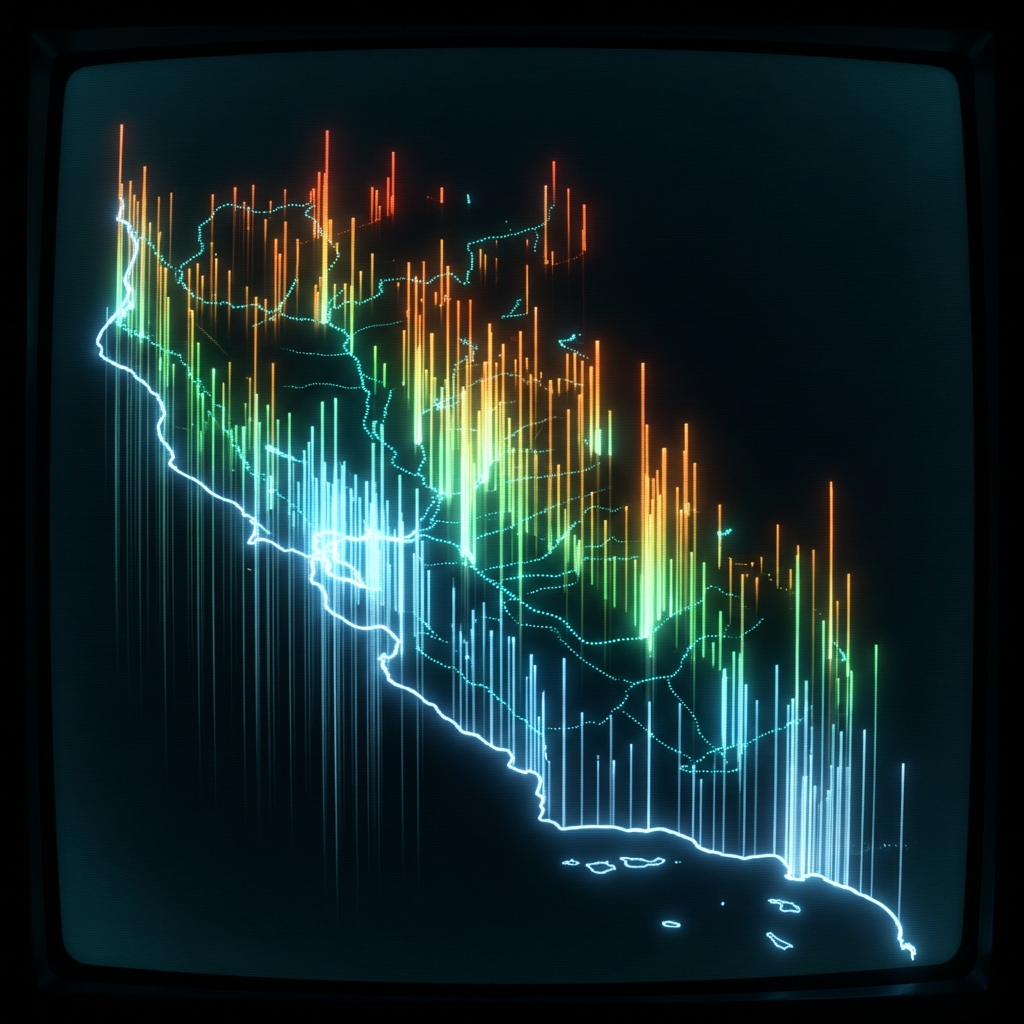 Chinook Salmon Abundance by Point FeaturesState of California