
Given a business's trade name and location, who actually owns it?
"BATTUBELIN" in Los Angeles is FARINATA LLC. A Dairy Queen franchise is run by N. MARKET RESTAURANT INC, a name that appears nowhere on the storefront or in any Google result. A sole proprietor operates as "Seyran's Kitchen & Catering" but no web page connects that name to SEYRAN SAFARYAN.
We call this business identity resolution: determining the legal entity behind a public-facing trade name. It's the foundation of Know Your Business compliance, and harder than it looks.
We built a benchmark to measure whether AI systems can solve business identity resolution, scoring exclusively against government records, not Enigma's own data.
Disclosure: Enigma is both the benchmark operator and one of the evaluated data sources. We controlled for this by scoring against external government records only and applying standard statistical tests. Full details in Methodology.
310 business entities from 6 independent US government registries (LA County, Miami-Dade, San Diego, NYC, Texas, multi-state corporate registries). 200 test forward resolution (trade name → legal entity), 110 test reverse (corporate name → consumer brand). Each provider received only the trade name, city, and state.
22 scored provider configurations spanning 7 model families from 5 AI labs, tested across three tiers:
All providers ran at temperature 1.0 with no prompt tuning.

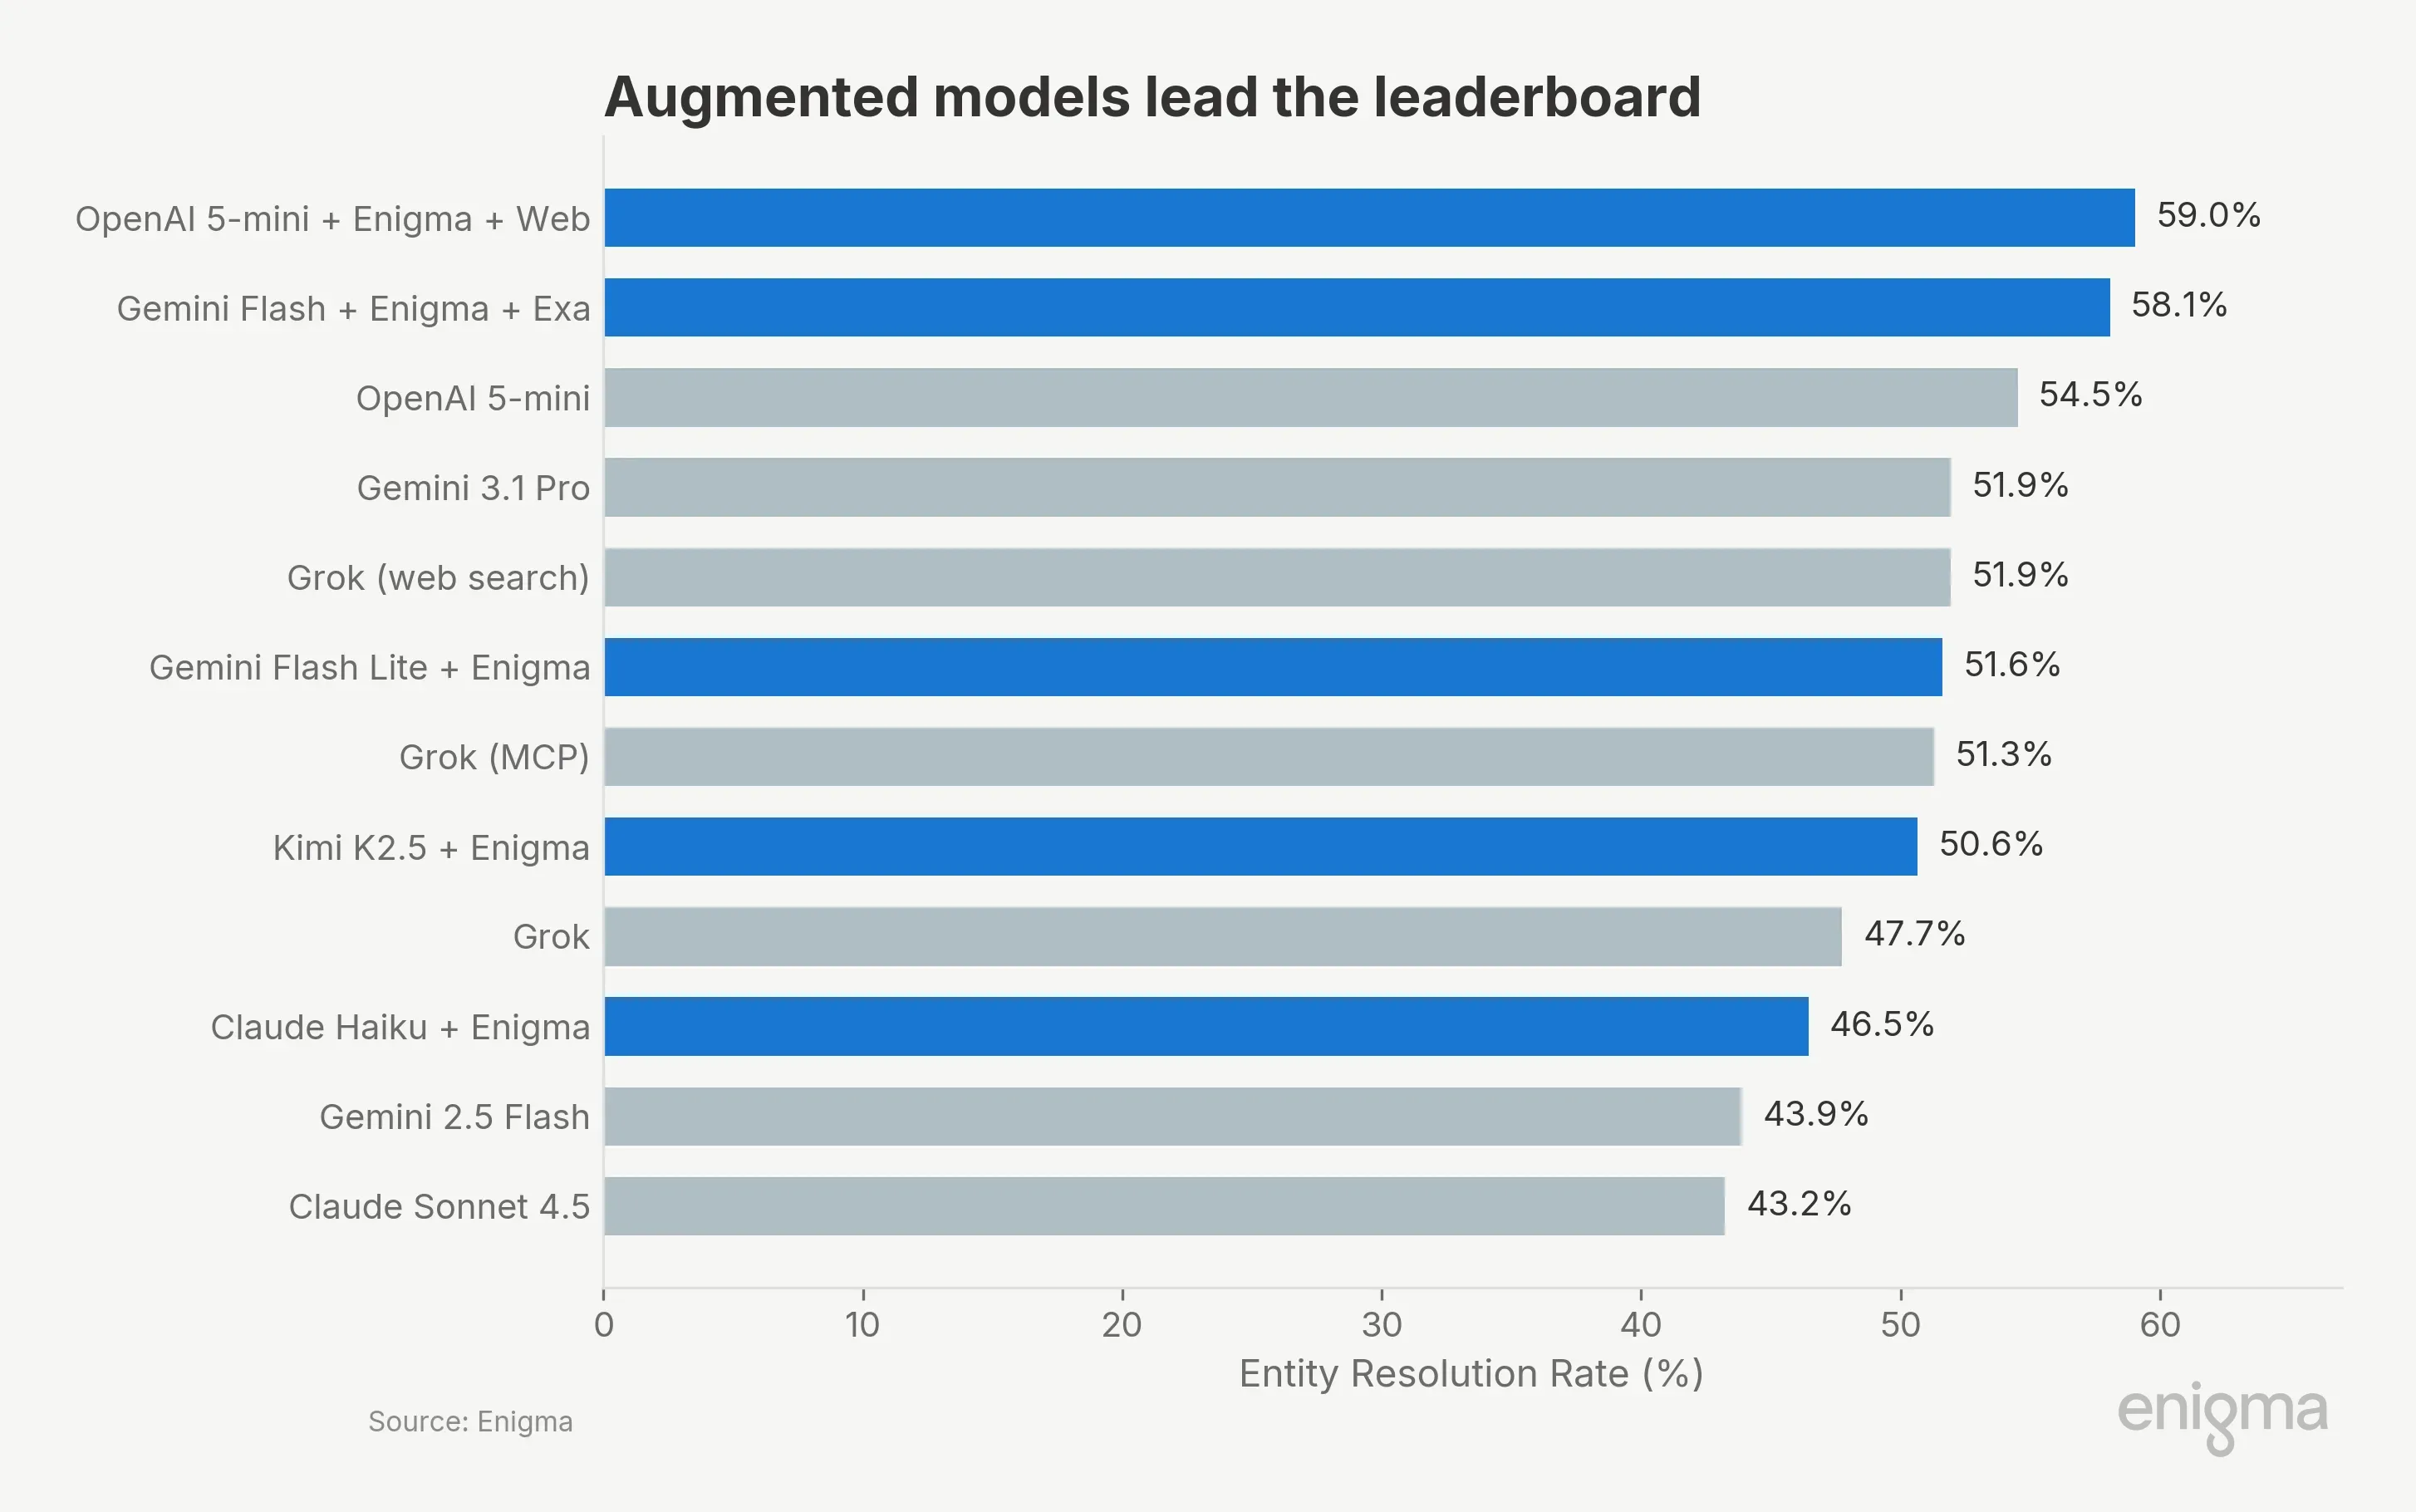
The #1 configuration at $6.45 outperforms Claude Sonnet by 15.8 percentage points at 1/9th the cost and Gemini 3.1 Pro by 7.1 points at 1/8th the cost. Both use Enigma's knowledge graph.
The top two are statistically tied (McNemar p=0.43) and both significantly outperform Grok and all lower-ranked standalones (p<0.001). Against standalone openai-5-mini, the strongest unaugmented model, the #1 configuration's lead is significant (p=0.026) but the #2's is not (p=0.42).
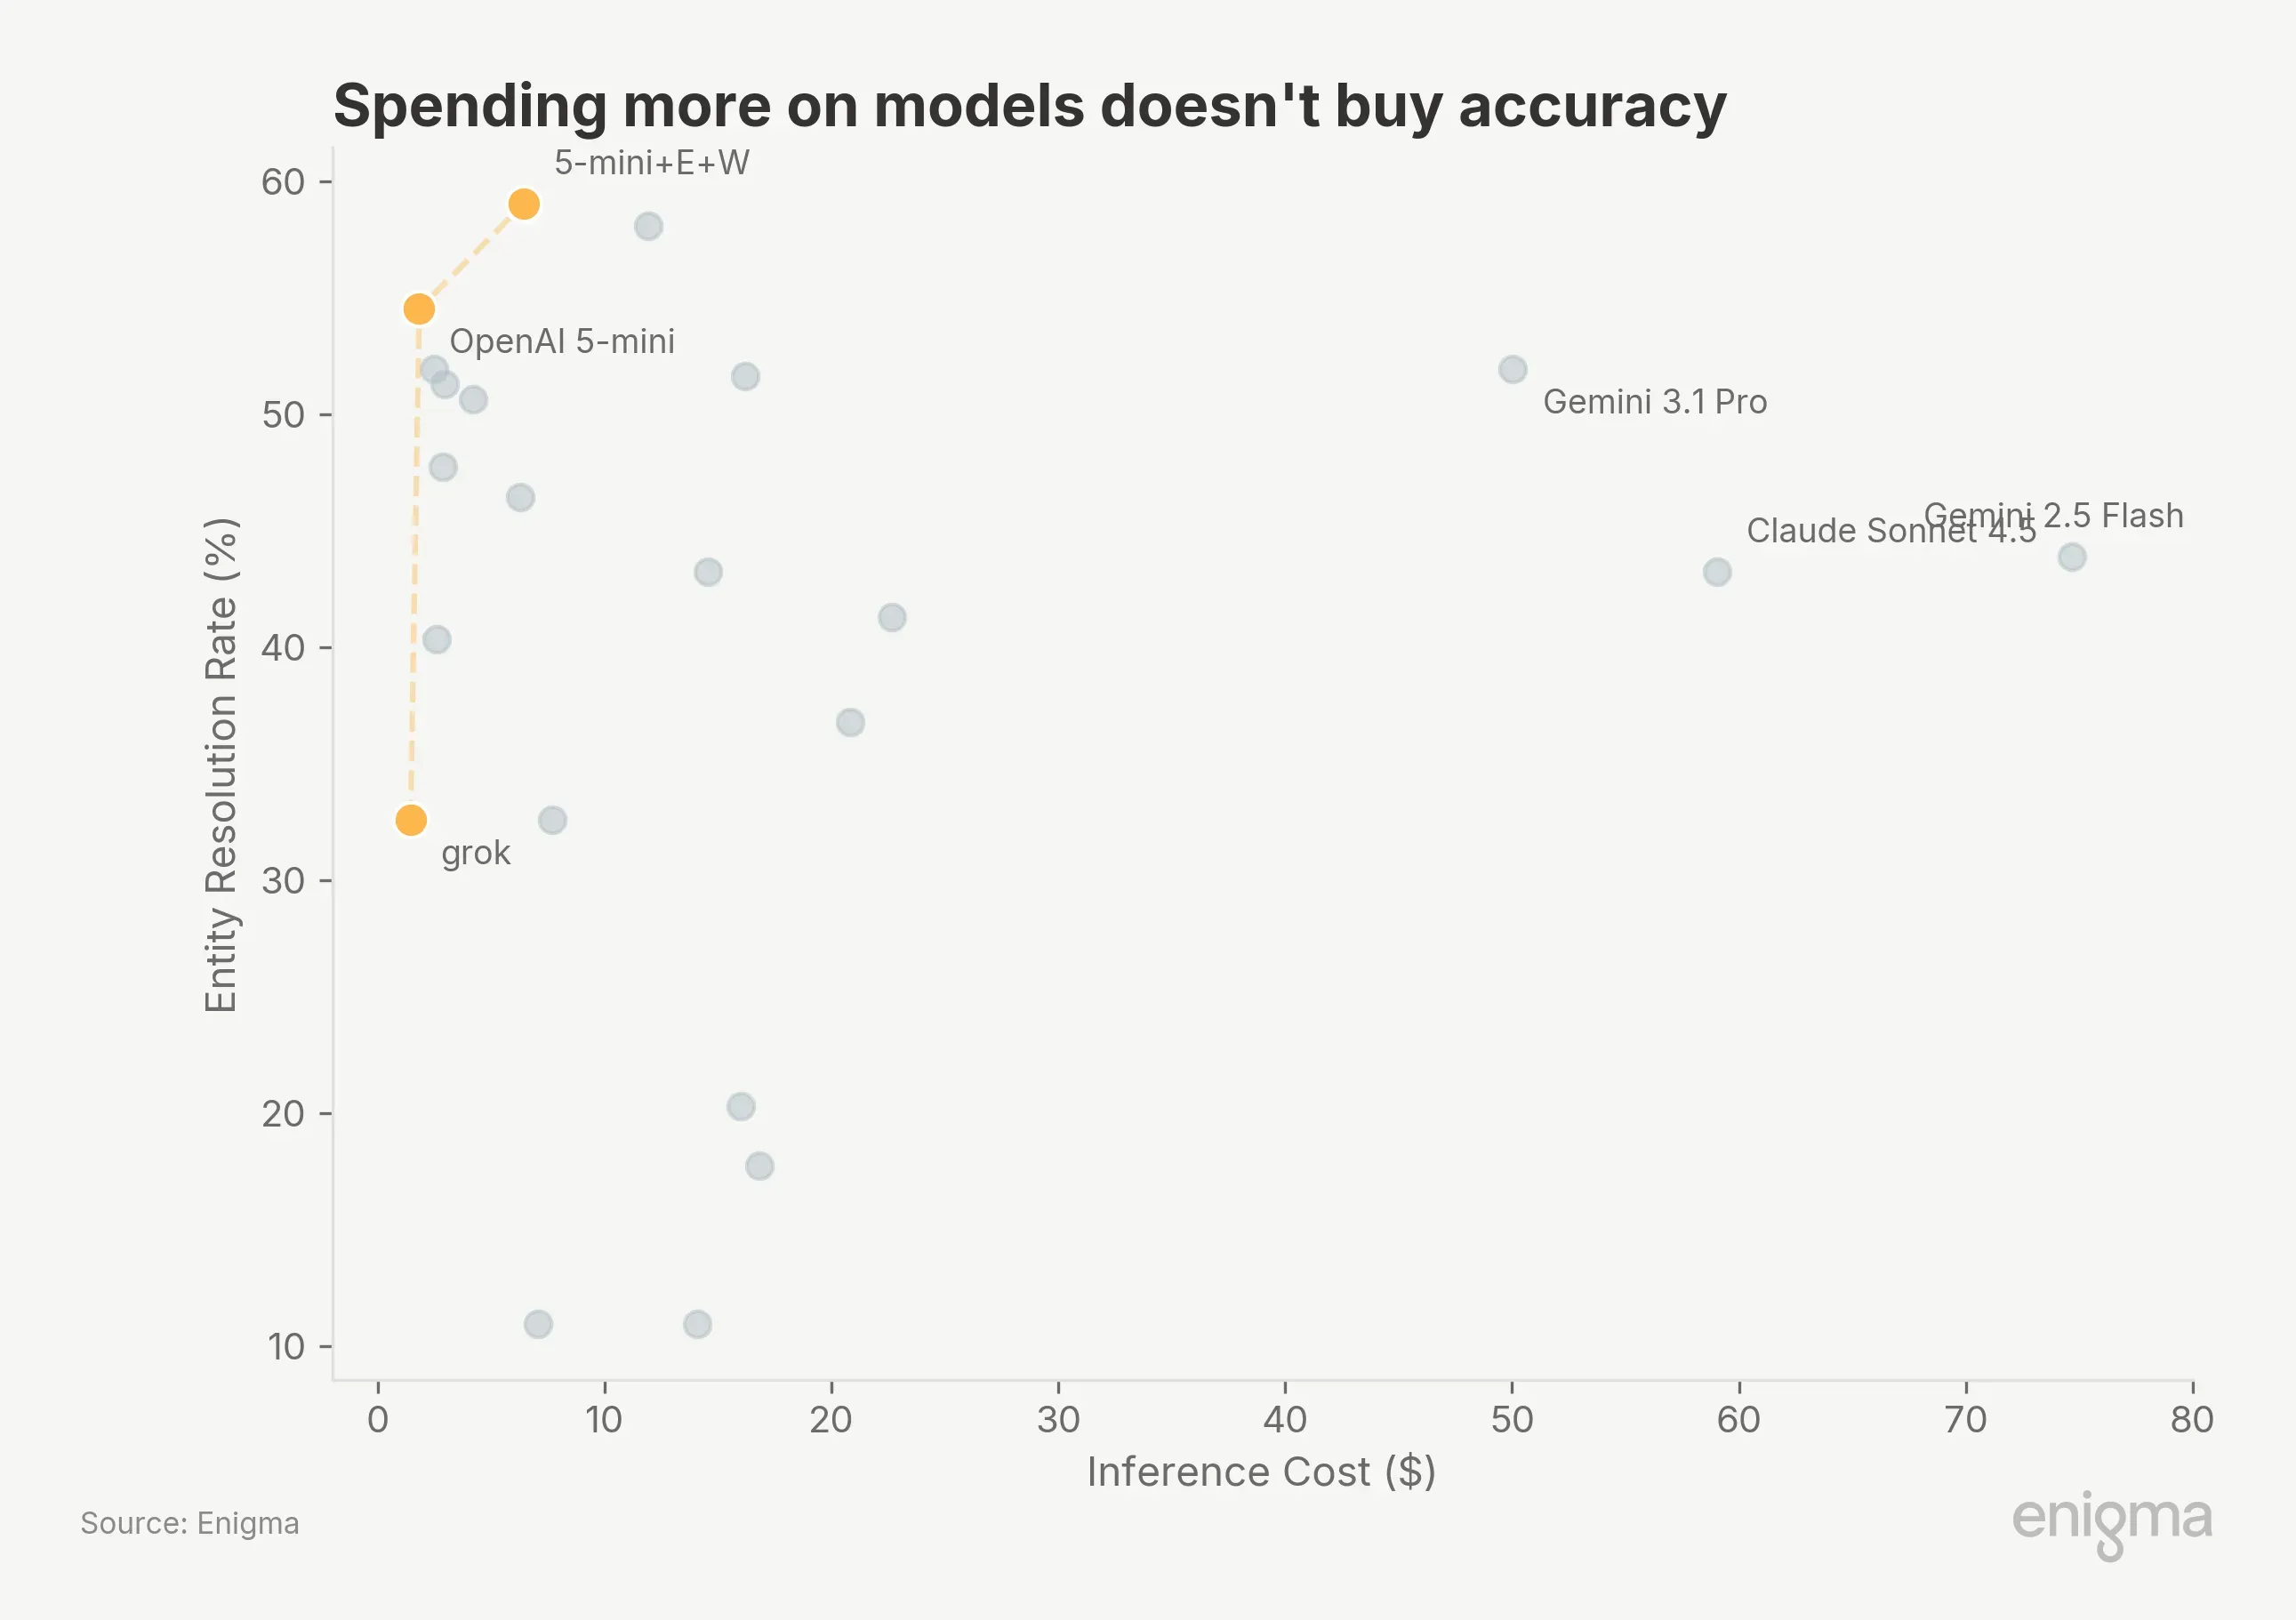
Premium models do not deliver premium results here. Gemini 3.1 Pro costs $50 for the same 51.9% that Grok achieves at $2.49. Gemini 2.5 Flash costs $74.66 (driven largely by search grounding charges) for 43.9%. Our read: the primary constraint is data access, not model size.
Cost is only part of the production equation. Latency and token consumption determine throughput:

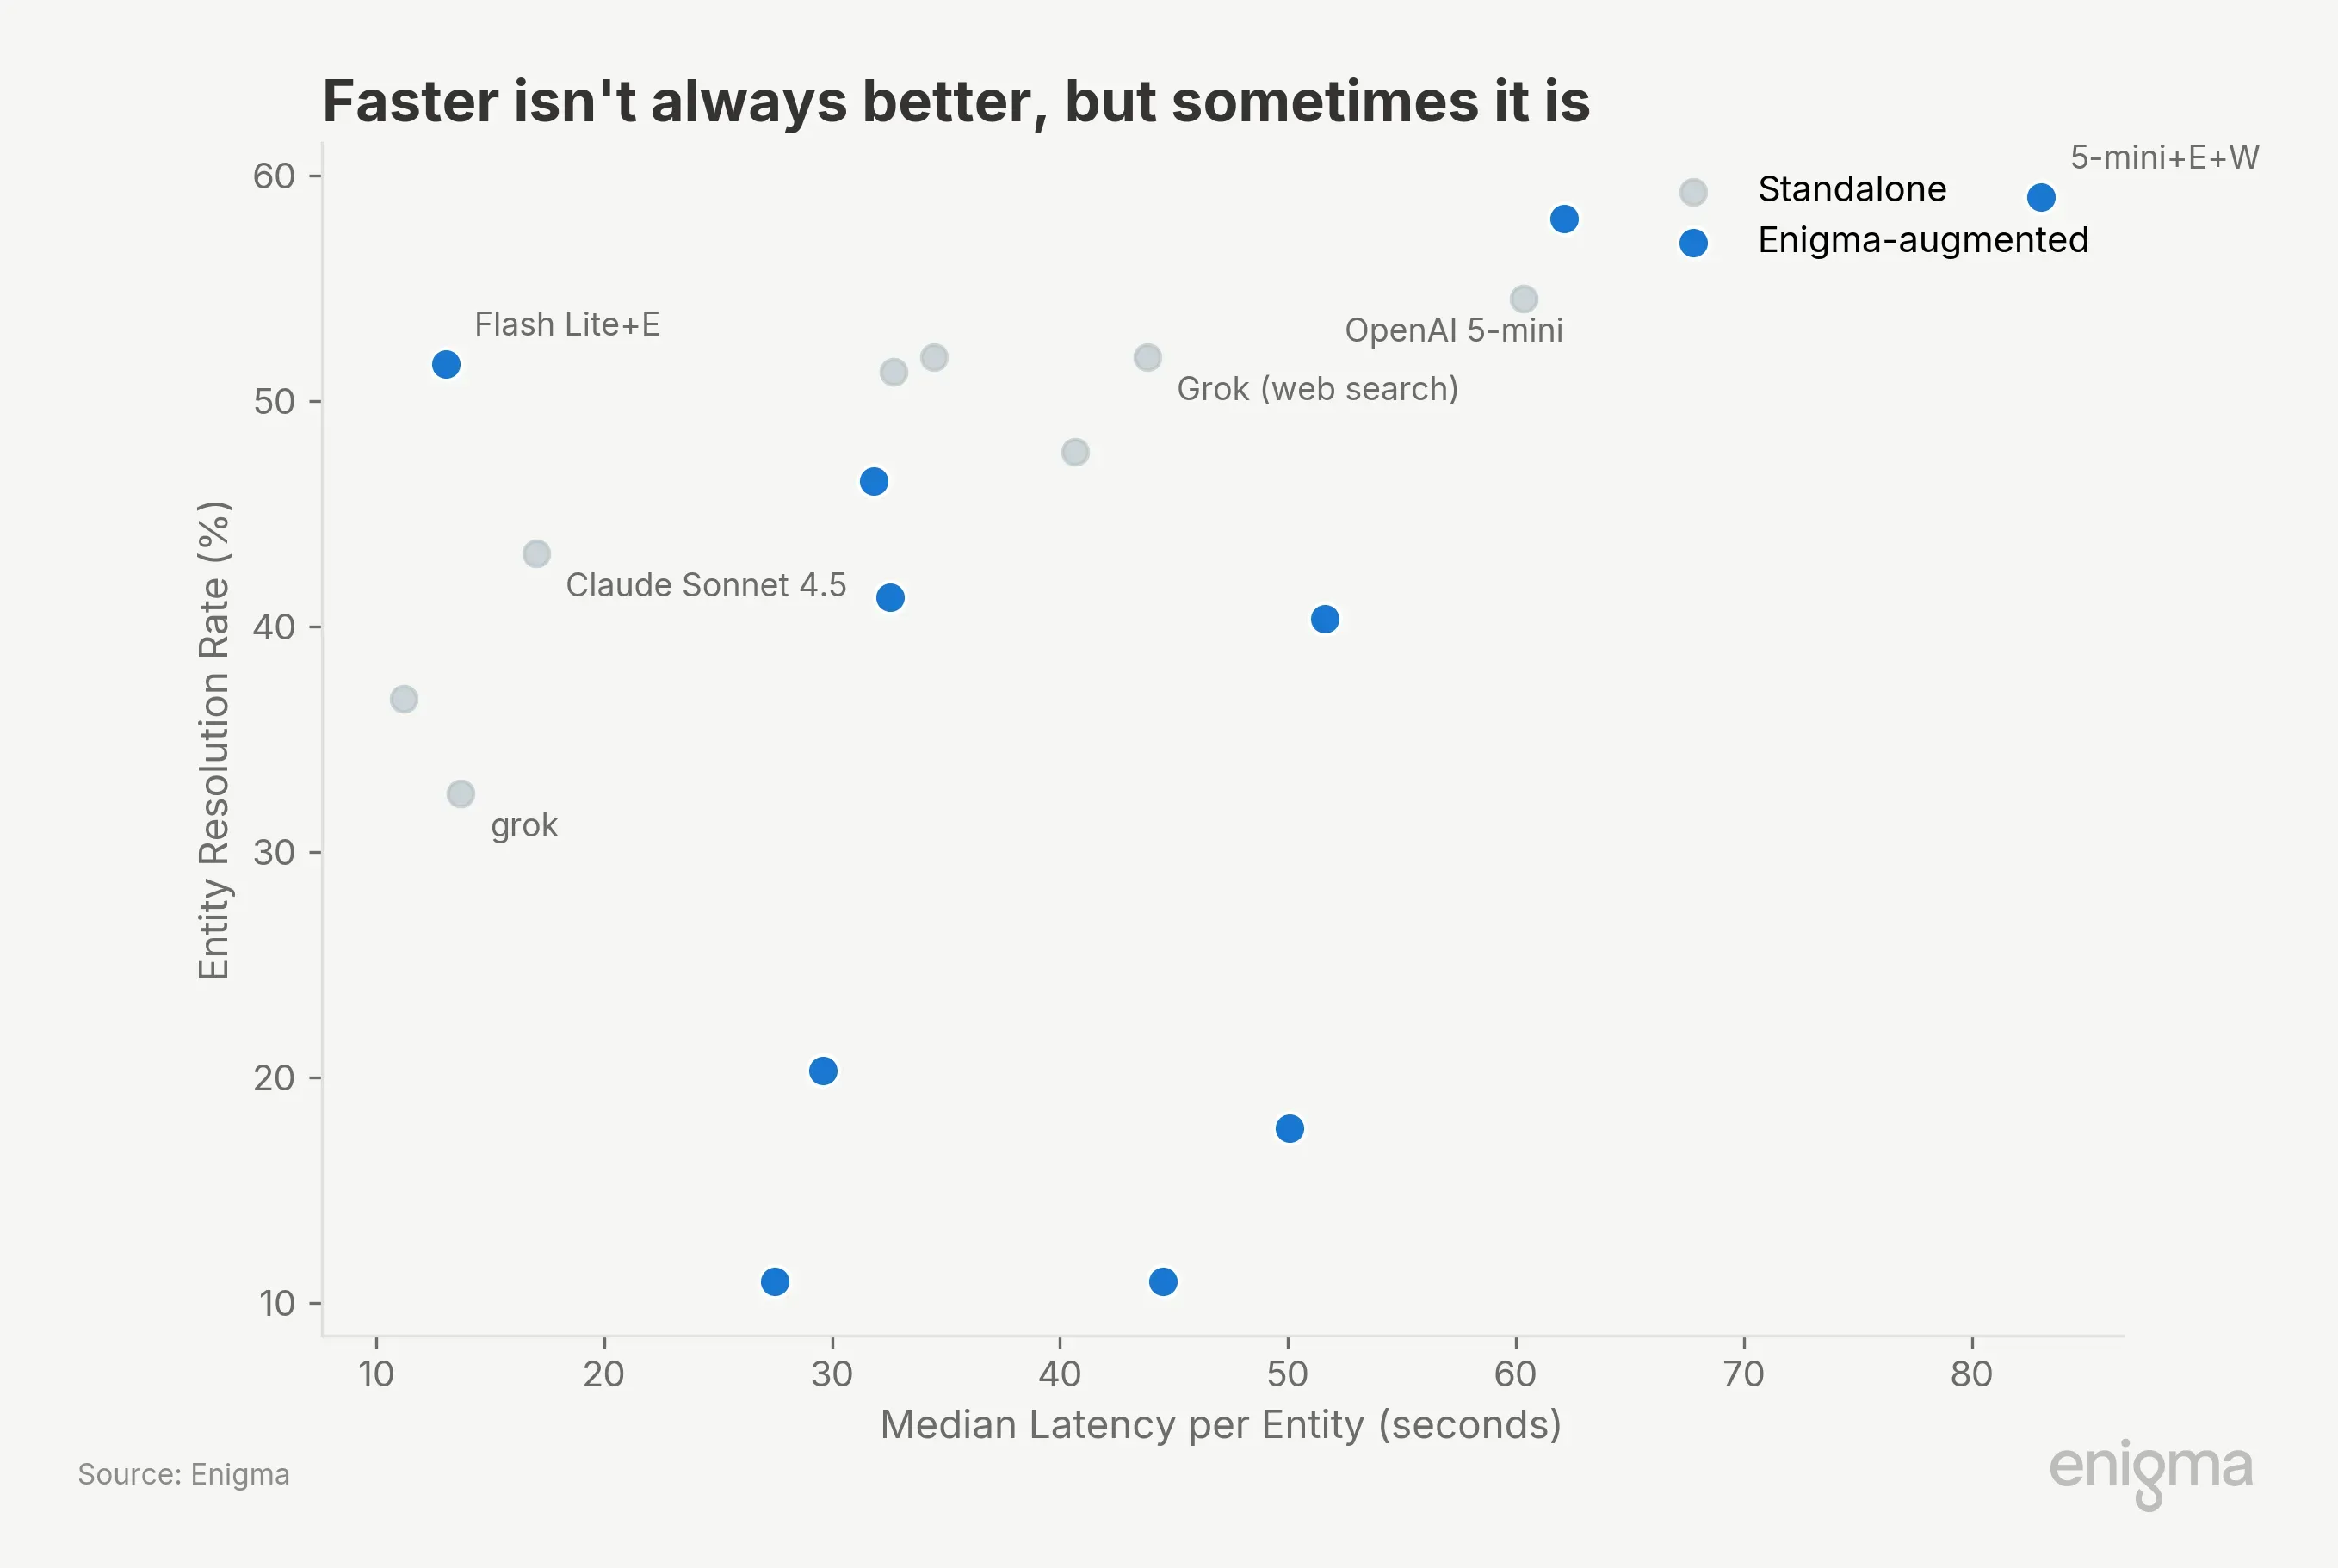
Gemini 3.1 Flash Lite + Enigma resolves entities in 13 seconds each at 51.6% accuracy, using 6,162 tokens per entity. Claude Sonnet takes 17 seconds but burns 8.4x more tokens for 8.4 percentage points less accuracy. The #1 configuration is the slowest (83s/entity) because it's doing the most work: knowledge graph call, evaluation, then web fallback. For batch processing that's fine. For real-time pipelines, the flash-lite + Enigma configuration offers a compelling speed/accuracy tradeoff at 3x the throughput.
Every model family we tested improved with Enigma augmentation:

Win/loss ratios range from 2.2:1 to 7.5:1. For moonshot, that's 60 entities gained vs. 8 lost. For every entity Enigma gets wrong, it resolves 2 to 7 the base model could not.
Why? Business entity resolution connects things with no obvious public relationship. "BLOOMSDAY GARDENING" → NEILAN, MICHAEL J (sole proprietor, no web presence, only a county filing). Every web search for "Dairy Queen" returns the national franchisor, not N. MARKET RESTAURANT INC. BATTUBELIN → FARINATA LLC. No amount of reasoning over the trade name bridges that gap. A knowledge graph that encodes these relationships does.
These are the cases that create compliance exposure. And these results come from Enigma's general-purpose MCP interface, not a purpose-built resolution tool. We're building dedicated tooling to make this easier.
We classified 33 entities as "hard," solvable by 1–3 of 22 providers:

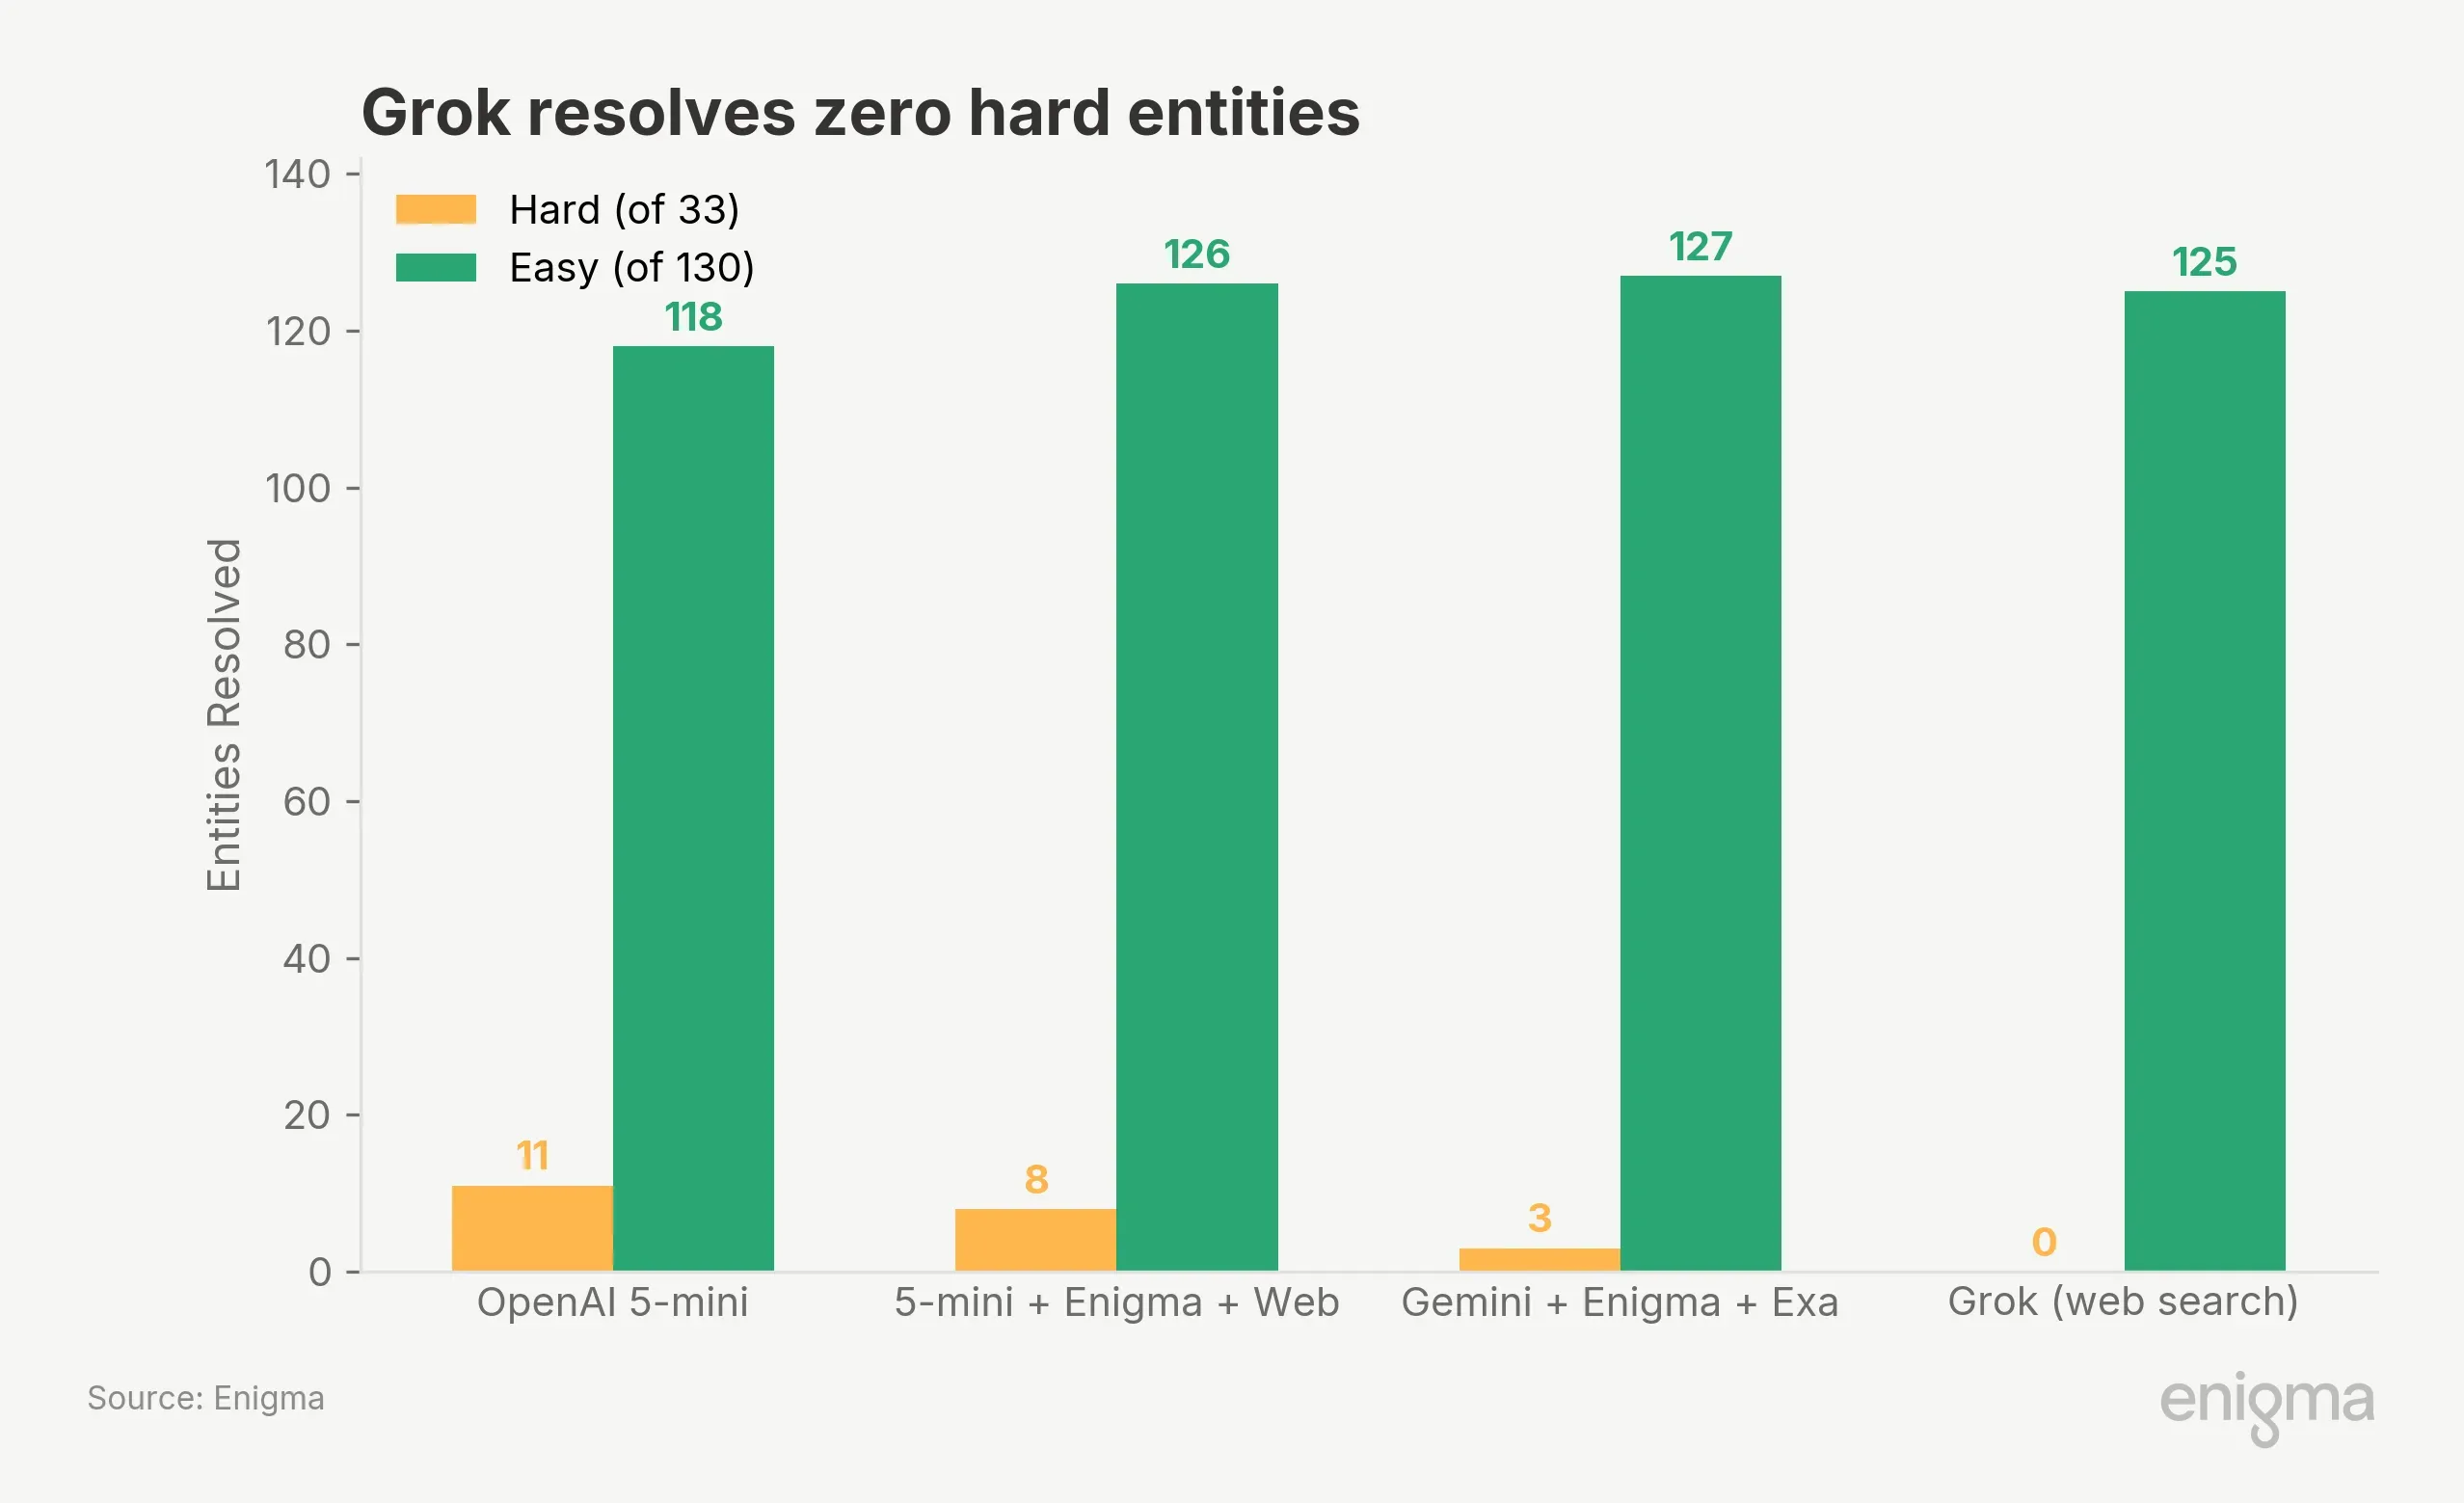
Grok at 51.9% resolves zero hard entities. Its accuracy is built entirely from easy entities where any search engine returns the right answer. On the hard entities where resolution failure creates compliance exposure, web-search-only approaches provide no signal.
The #1 provider also solves fewer hard entities (8) than standalone openai-5-mini (11), winning its lead on medium and easy entities instead. Hard-entity performance and overall ER% measure different things.
Adding a knowledge graph to a strong model without a web fallback caused a 14.2 percentage point regression.
openai-5-mini+enigma (no web) scored 40.3%, below the 54.5% standalone (McNemar p<0.001). Of 55 entities hurt, 48 were pipeline failures where the model couldn't recover from an empty knowledge graph response.
openai-5-mini+enigma+web scored 59.0%, recovering all 48 failures via web fallback. Augmentation lifts weak models dramatically (moonshot: +18pp), but strong models need the web safety net. Always keep a fallback path.
Scoring: ER% = correct legal entity identification over all 310 entities. Names normalized and fuzzy-matched at ≥90% token similarity (F1=0.995). Statistical testing via McNemar's test on paired outcomes (80% power to detect 7pp differences at N=230). Test statistics: top two tied at χ²=0.62; #1 vs. grok-mcp-responses-web χ²=11.61, p<0.001; #1 vs. standalone openai-5-mini χ²=4.97, p=0.026.
Entities: 310 from 6 independent US government registries (200 forward, 110 reverse). Providers received DBA name, city, state only; legal entity and address withheld to prevent contamination.
Ground truth verification: An independent analyst verified 85 entities, correcting 18 government record errors and flagging 13 as ambiguous. 49 entities with unreliable ground truth (40 from Miami-Dade) excluded from difficulty scoring but retained in ER% calculation, making accuracy numbers conservative.
Architectures: Most +Enigma providers use an agentic pattern (knowledge graph call → evaluate → optional web fallback). Gemini variants use Exa's web search via function calling due to API constraints, making them traditional retrieval-augmented rather than agentic.
Costs: Inference only (tokens + web search + tool calls). Enigma knowledge graph access priced separately. Gemini search grounding ~$0.035/query; OpenAI web_search pricing not fully disclosed.
Limitations: US entities only. 310-entity curated sample (not random). Temperature 1.0, single-run (±1–2pp variance expected). Four configurations suffered API failures. Government records may contain errors beyond those we corrected.
Per-entity results, scoring code, and the full 23-provider leaderboard are coming soon. Email updates@enigma.com to be notified when the harness code and sample data are released.
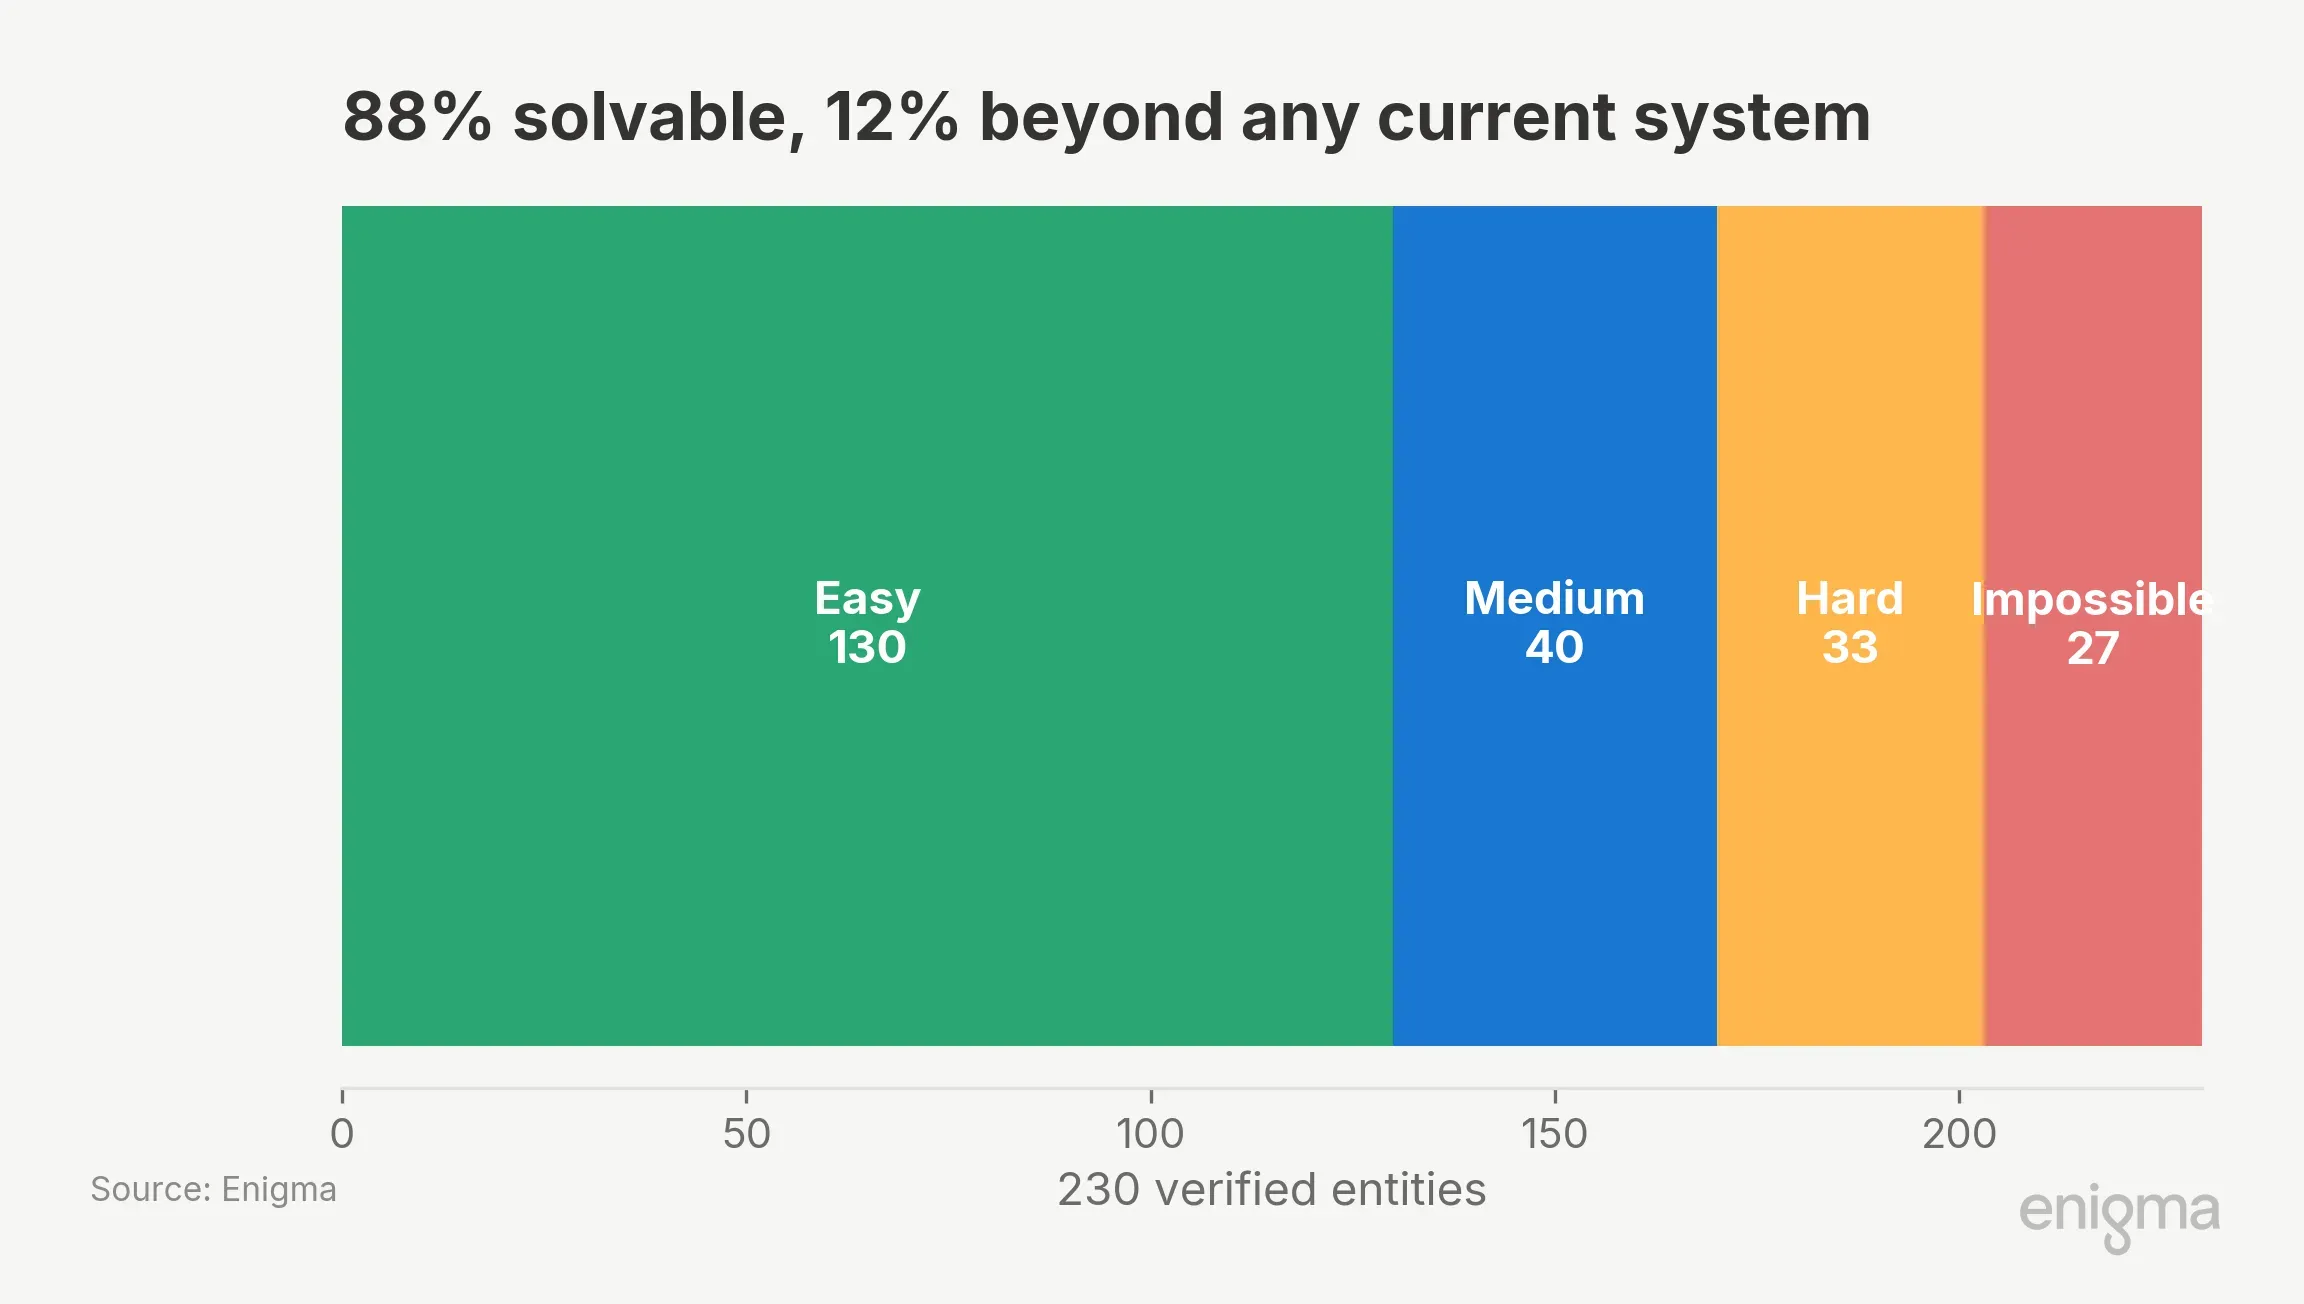
Of 230 verified entities, 27 were resolved by zero providers across all 22 configurations: franchise DBAs with opaque holding structures, catering subsidiaries, sole proprietors with only paper filings. The solvable ceiling is about 88%. The #1 configuration resolved 158 of those 203 solvable entities (78%). Any system claiming 100% is filling fields with confident guesses. The gap between 78% and 88% is where the next improvement lives. Nothing in this benchmark suggests that bigger models, rather than better data, will close it.
If you're evaluating vendors for entity resolution, ask for hard-entity accuracy, not headline numbers. If you're building pipelines, budget for data access before model upgrades, and never ship augmentation without a fallback. The $6 configuration that won this benchmark didn't win because the model was smart. It won because the model had access to answers that don't exist on the open web.