Ensuring Unparalleled Data Quality in Enigma's graph-model-1
Executive Summary
Enigma’s graph-model-1 represents the most comprehensive, accurate, and expressive representation of the U.S. business landscape available today. This whitepaper details the robust, multi-layered data quality framework that powers graph-model-1, explaining the methodologies, validation processes, and quality control mechanisms that ensure our data accurately reflects the real world.
For organizations relying on business data for critical functions—whether for compliance, marketing, risk assessment, or strategic planning—the quality of that data directly impacts operational effectiveness and business outcomes. Enigma’s rigorous approach to data quality delivers measurable advantages, with validation metrics that consistently exceed industry standards.
Introduction: The Data Quality Imperative
Business data is only as valuable as it is accurate, descriptive, timely, and reliable. The quality challenges inherent in business data are substantial:
- Businesses constantly form, evolve, and dissolve
- Records become outdated within weeks or months
- Information across sources frequently conflicts
- The same business may have multiple manifestations (legal entities, brands, locations)
- Data entry errors and inconsistencies are common in source records
These challenges are compounded when attempting to create a complete picture of the U.S. business landscape, which includes over 30 million active businesses operating across diverse industries, locations, and organizational structures.
While millions of business entities exist on paper, Enigma’s graph-model-1 applies rigorous activity criteria to identify the 13 million “Marketable Brands” that demonstrate genuine market presence. This distinction represents businesses with verified operational signals, revenue generation, and complete attribution data. By identifying dormant entities, shell companies, and paper-only registrations, we ensure our customers build strategies on businesses with actual commercial activity.
Enigma’s graph-model-1 addresses these challenges through a knowledge graph approach, combining multiple high-quality data sources with sophisticated entity resolution and linking models, all governed by a comprehensive quality assurance framework. This approach allows us to maintain data accuracy at scale, even as the business landscape continually changes.
Enigma’s Multi-Layered Data Quality Framework
Foundation: Trusted Data Sources and Data Quarantine
At the foundation of our system is high-quality data from trusted sources. Enigma carefully vets all data sources to ensure our core records and decisioning rely only on data we can trust. We prioritize authoritative sources such as:
- Government registries (Secretary of State filings)
- State business registrations
- Annual report filings
- Corporate dissolution records
- Officer and director listings
- Federal employer identification (EIN) records
- Federal Trade Commission disclosures
- State business registrations
- Franchise disclosure documents
- Medical provider lists
- Federal licensing data
- Other regulatory sources
Even with these trusted sources, we don’t assume all information is correct or consistent across sources. We implement rigorous validation:
- We verify and standardize more than 65 million addresses using the United States Postal Service’s official US address database
- We validate that over 50 million websites are accessible and functional
- We quarantine questionable records with invalid or conflicting information for further evaluation
- We maintain EnigmaDB, our internal database of record, to correct verified issues at the source, preventing error propagation
Data Pipeline Architecture and Refresh Cadence
Enigma’s data pipeline is designed to maintain freshness while ensuring quality:
- New source data is ingested daily
- The complete data processing pipeline runs weekly
- Each pipeline run processes all historical and new data
- This approach captures business formations, closures, and operational changes in near real-time
- Weekly refresh cycles support time-sensitive use cases like trigger marketing and risk assessment
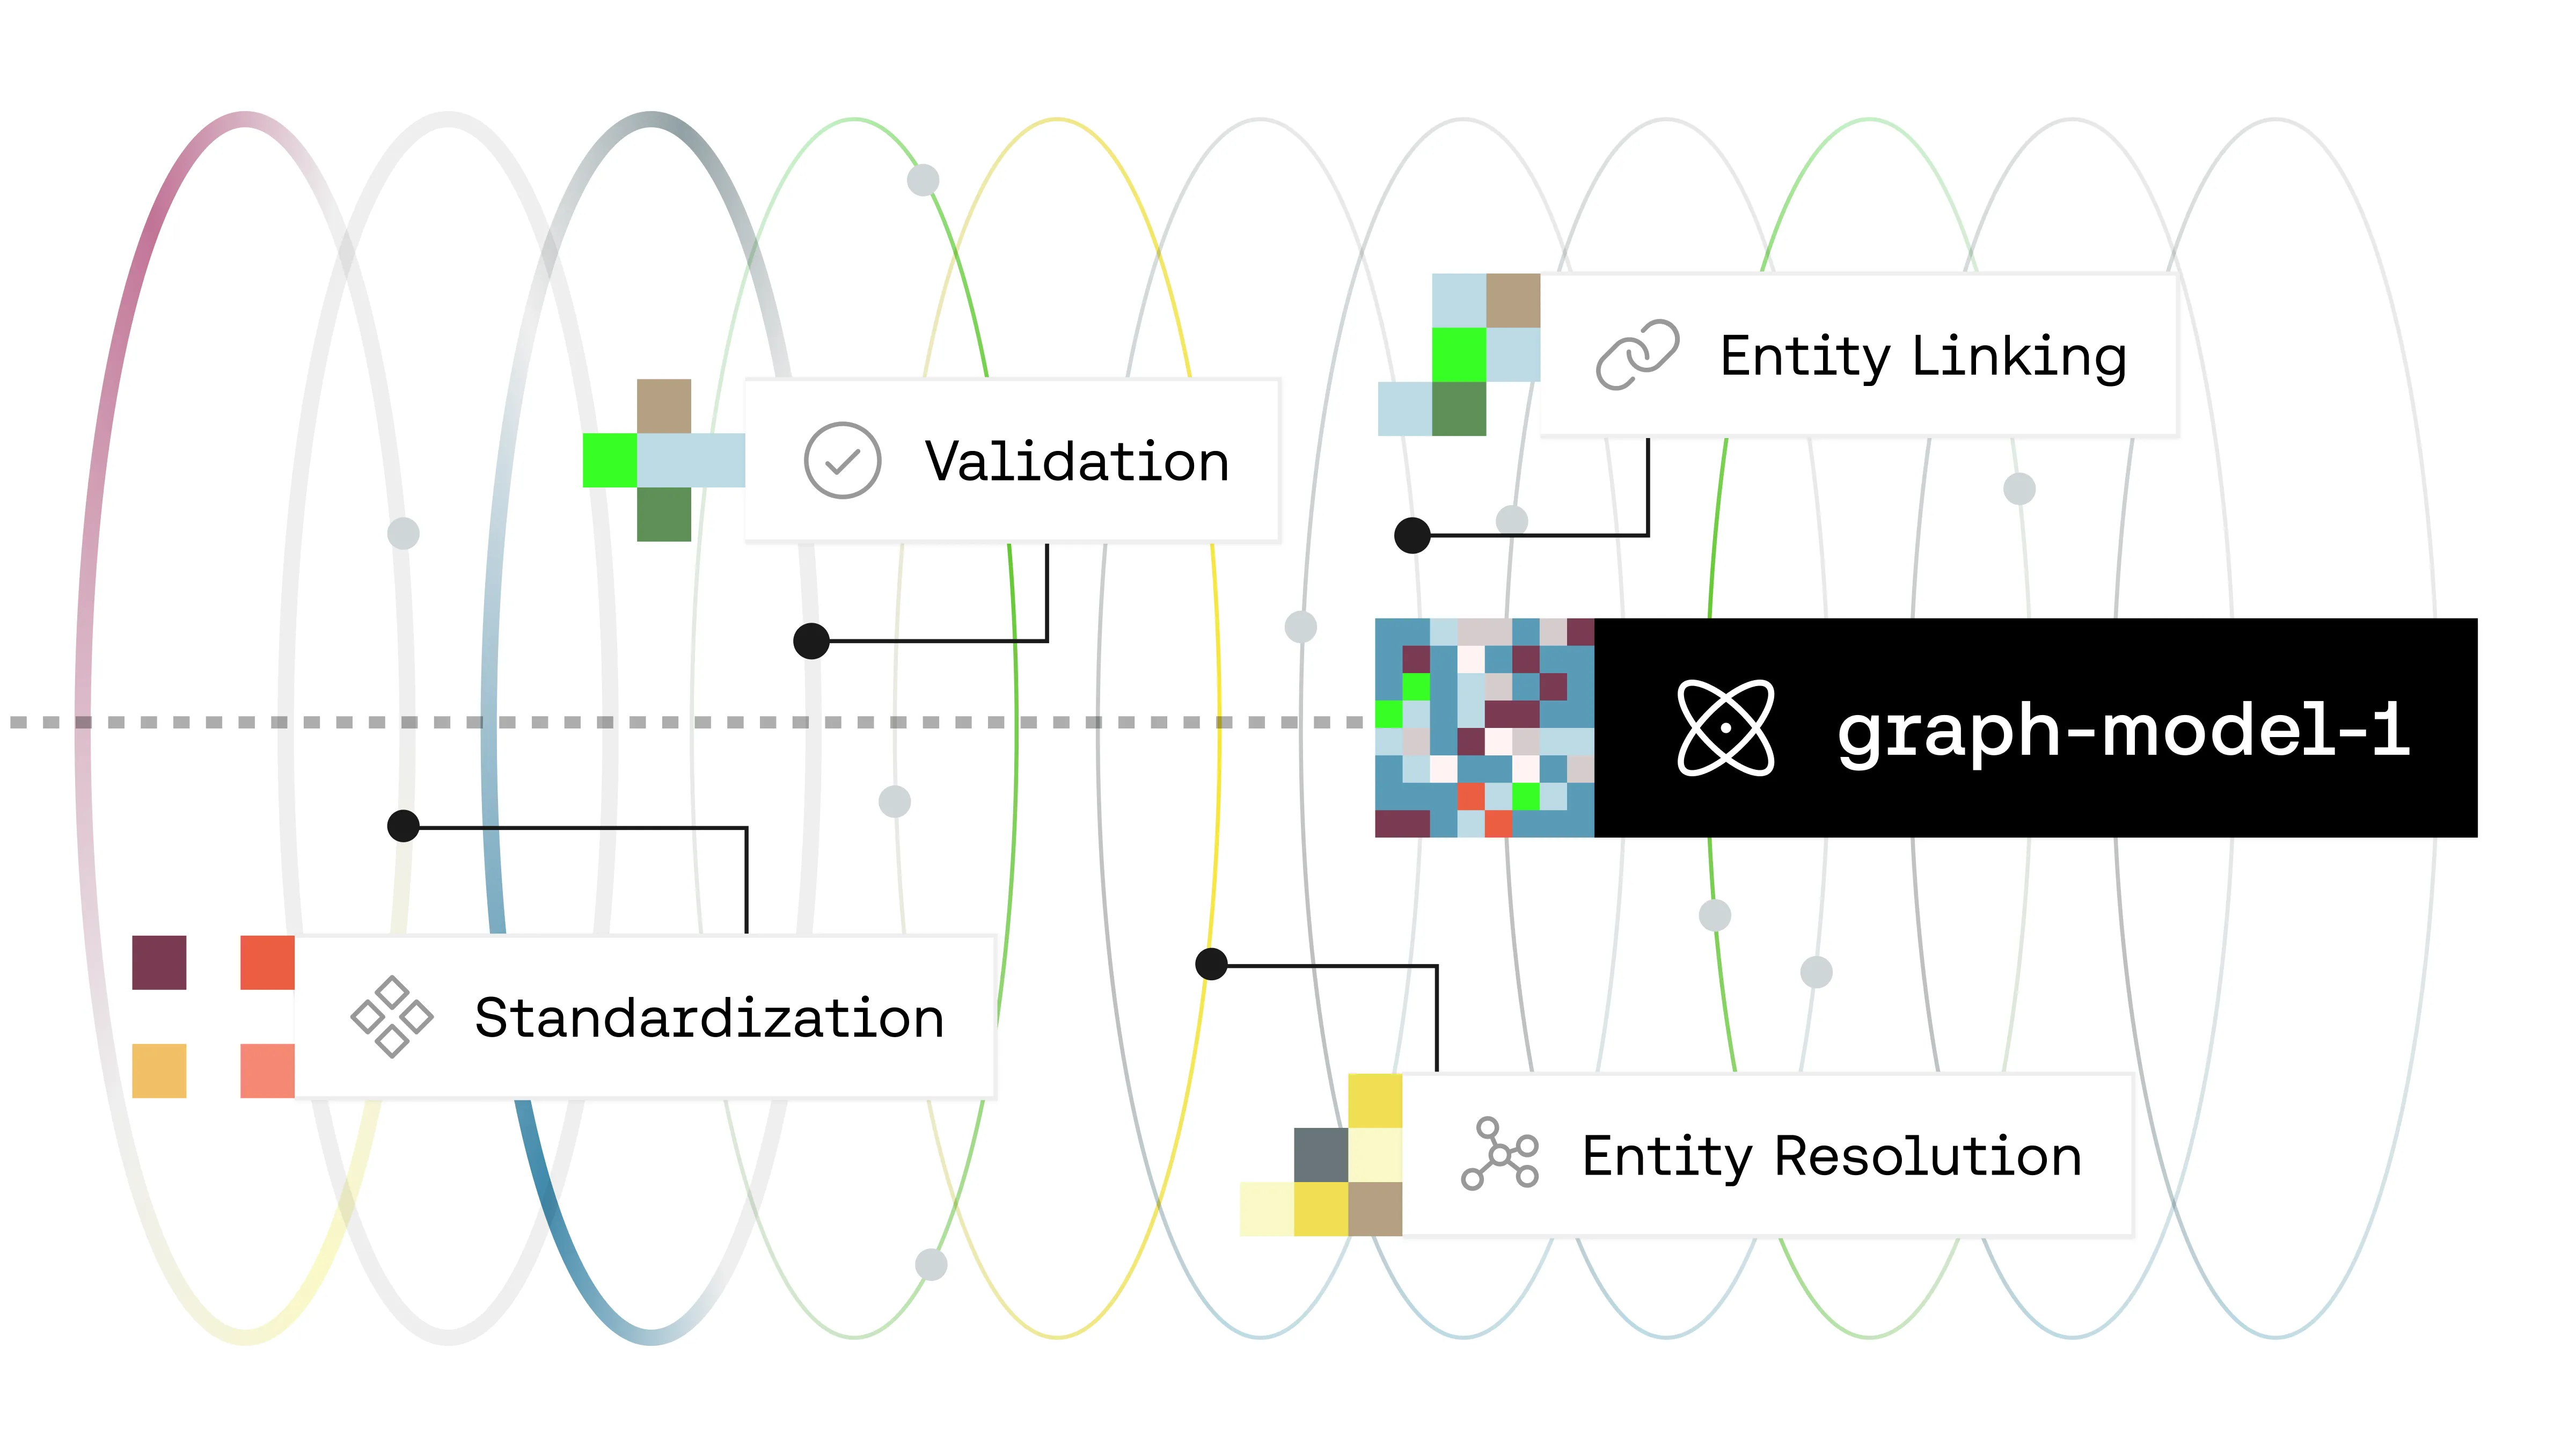
High-Precision Models for Entity Resolution and Linking
Our data pipeline employs sophisticated statistical models for:
Entity Resolution: Resolving over 600 million raw brand records down to more than 45 million distinct brands and operating locations
Entity Linking: Connecting more than 8 million brands to their associated legal entities
Attribute Prediction: Determining key attributes like industry classification (NAICS codes)
For each model, we develop comprehensive ground truth datasets for validation and won’t implement models unless they exceed high precision thresholds. We continuously benchmark new models against baseline heuristics and existing approaches to ensure improvements.
When models don’t align with reality (e.g., a recent merger not yet reflected in registry data), we utilize EnigmaDB to manually correct assertions. These corrections not only improve current data but inform future model training.
Quality Validation Methodology
Enigma employs a multi-faceted approach to validation:
Gold-Star Dataset Validation
We maintain carefully curated ground truth datasets:
- Brand & Operating Location Set: ~400 brands and 2,500 operating locations
- Brand-to-Merchant Linking Set: ~100 brands with 200,000-300,000 merchant links
- Store Location Revenue Validation Set: >20,000 stores with externally verified operating location revenues
These datasets are actively maintained and expanded, providing reliable benchmarks for each release. They’re designed to cover diverse business types, industries, and edge cases.
Statistical Monitoring
We track key metrics across releases, including:
- Fill rates for critical attributes
- Revenue shifts and distribution
- Projection stability between releases
- Entity counts and distributions
Our systems automatically flag deviations beyond defined thresholds, triggering investigation before release.
Pipeline Quality Gates
Our pipeline incorporates two types of quality gates:
Blocking Checks: These enforce zero-tolerance or threshold-based requirements that halt pipeline progress until resolved. Examples include:
- Duplicate detection
- Relationship rule validation
- Minimum coverage requirements
Alerting Checks: These monitor trends without blocking releases, providing visibility into data health over time.
We implement over 492 data checks across 188 datasets and pipeline stages. These checks become increasingly stringent as data moves through the pipeline, ensuring issues are caught early.
Continuous Monitoring and Quality Checks
Real-time Alerting System
Each week when we refresh our pipeline, the data undergoes comprehensive monitoring:
- Data Freshness: Ensuring we have the latest available data across all sources
- Threshold Alerting: Generating warnings or blocking releases when metrics exceed expected thresholds
- Engineering Checks: Preventing regressions and enforcing consistency
Trend Monitoring
Before datasets go live, we verify completeness and consistency against previous releases:
- Visual dashboards track trendlines across key metrics
- Automated tools identify and surface significant changes
- Before/after comparisons highlight distribution shifts
This approach helps identify subtle quality issues that might not trigger threshold alerts but could indicate emerging problems.
Automated and Human-in-the-Loop Validation
We combine automated checks with human expertise:
- Automated anomaly detection identifies outliers and unusual patterns
- Statistical comparisons against ground truth data validate model performance
- Human verification (including LLM-assisted labeling) assesses attribute quality
Each month, we manually review 2,000-5,000 random samples per attribute, with precision targets such as:
- 95% for operating location attributes
- 80% minimum for other key fields
- 98% accuracy for industry NAICS codes
- 70% of card revenue estimates within ±30% of ground truth
Quality Metrics and Performance
Precision and Accuracy Statistics
graph-model-1 maintains exceptional quality metrics:
- Entity Linking: 95% precision in connecting brands to their legal entities. 94% of brands have all links to their operating locations
- Industry Classification: 98% accuracy for NAICS code assignments
- Location Data: 95% precision for operating location status and addresses
- Revenue Estimation: 70% of card revenue estimates within ±30% of actual values.
Focus: Revenue Estimation
This level of accuracy represents a significant achievement in small business revenue estimation, where traditional methods often fail due to:
- Limited financial disclosure requirements for privately-held businesses
- Limited or non-existent digital footprints for micro-enterprises
- High variability in month-to-month revenue for seasonal or emerging businesses
- Multiple payment channels that fragment transaction data
For businesses with annual revenues under $1M, industry standard estimates often vary by factors of 2-3x or more, making Enigma’s ±30% precision particularly valuable for organizations seeking to effectively segment and target the SMB market. This granularity enables:
- More precise market sizing of local business ecosystems
- Accurate classification of businesses into appropriate revenue bands for propensity modeling
- Reliable identification of high-growth micro-businesses before they appear in conventional datasets
- Better allocation of marketing and sales resources based on actual revenue potential rather than proxy indicators
Real-world Performance Examples
Our quality framework delivers tangible business outcomes:
- A leading fintech company streamlined their onboarding process using graph-model-1, reducing business verification time by over 40% and lowering false positives in risk flagging by 25%
- A financial marketing firm saw their average lift in response improve by 208% using Enigma’s core business records, relative to other business data firms. That uplift jumped to 346% for that same use case when they incorporated Enigma’s revenue metrics as part of that process.
- A financial services provider achieved 99.5% recall precision on transaction merchant linking
Business Impact and Conclusion
With graph-model-1, organizations can trust that their decisions—whether for compliance, marketing, risk assessment, or strategic planning—are grounded in accurate, high-quality data.
The business impacts are substantial:
- For Compliance: Reduced false positives, faster onboarding, and lower manual review rates
- For Marketing: Improved targeting precision, higher conversion rates, and better ROI
- For Risk: Enhanced fraud detection, more accurate underwriting, and reduced exposure
- For Strategy: Better market sizing, competitive intelligence, and opportunity identification
Enigma’s comprehensive approach to data quality isn’t just a technical achievement—it’s a business driver that delivers measurable value across use cases.
To learn more about how Enigma’s graph-model-1 can power your organization’s decisions with confidence, contact us today.