Peak Revenue Month: Why Payments Companies Are Seeing 2x Response Rates With Temporal Targeting

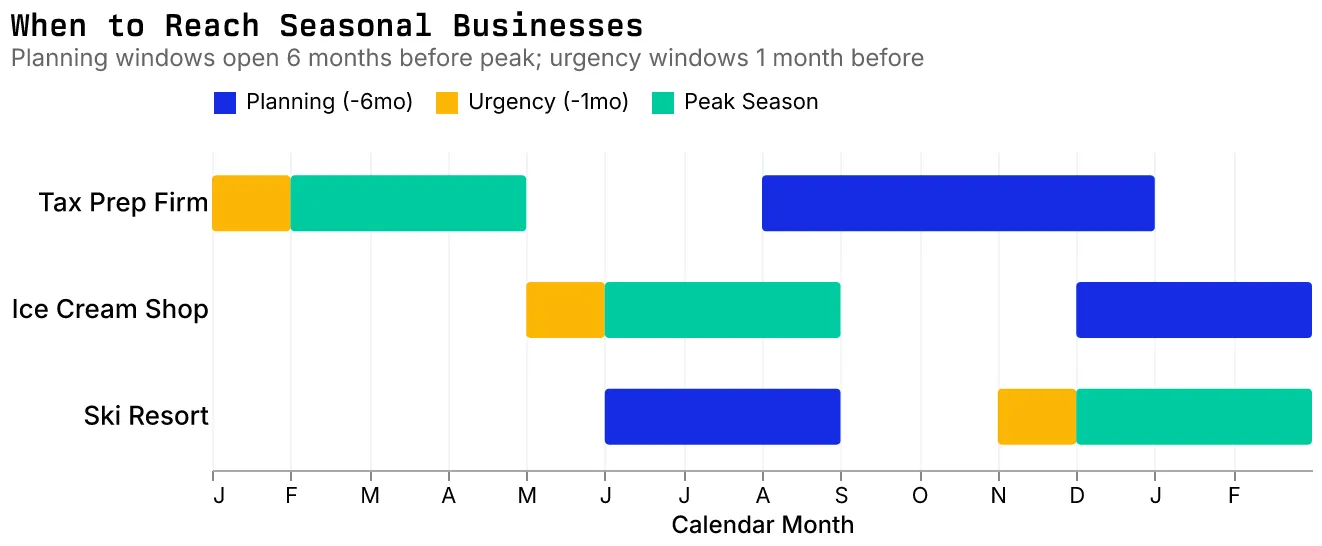
Businesses don’t make purchasing decisions at random times. A tax prep firm generating 70% of revenue between February and April makes virtually all strategic purchases between September and November. Ice cream shops peaking in July plan in January. Ski resorts hitting peak in January plan in July.
This pattern, validated across two years of controlled A/B testing with a major direct mail consultancy, has now been operationalized as a data attribute in Enigma Enterprise. For payments companies specifically, the results are striking: response rates for merchant services campaigns nearly double when timed to a business’s planning window.
The Evidence: Two Years of Controlled Testing
Our partner has been testing Enigma data against other providers since 2023. Two findings stand out.
Finding 1: The Six-Month Window
The consultancy retroactively appended peak month information to Enigma records used in demand generation campaigns for business banking. The goal was to identify whether timing relative to a business’s peak month affected response rates.
It did. Dramatically.
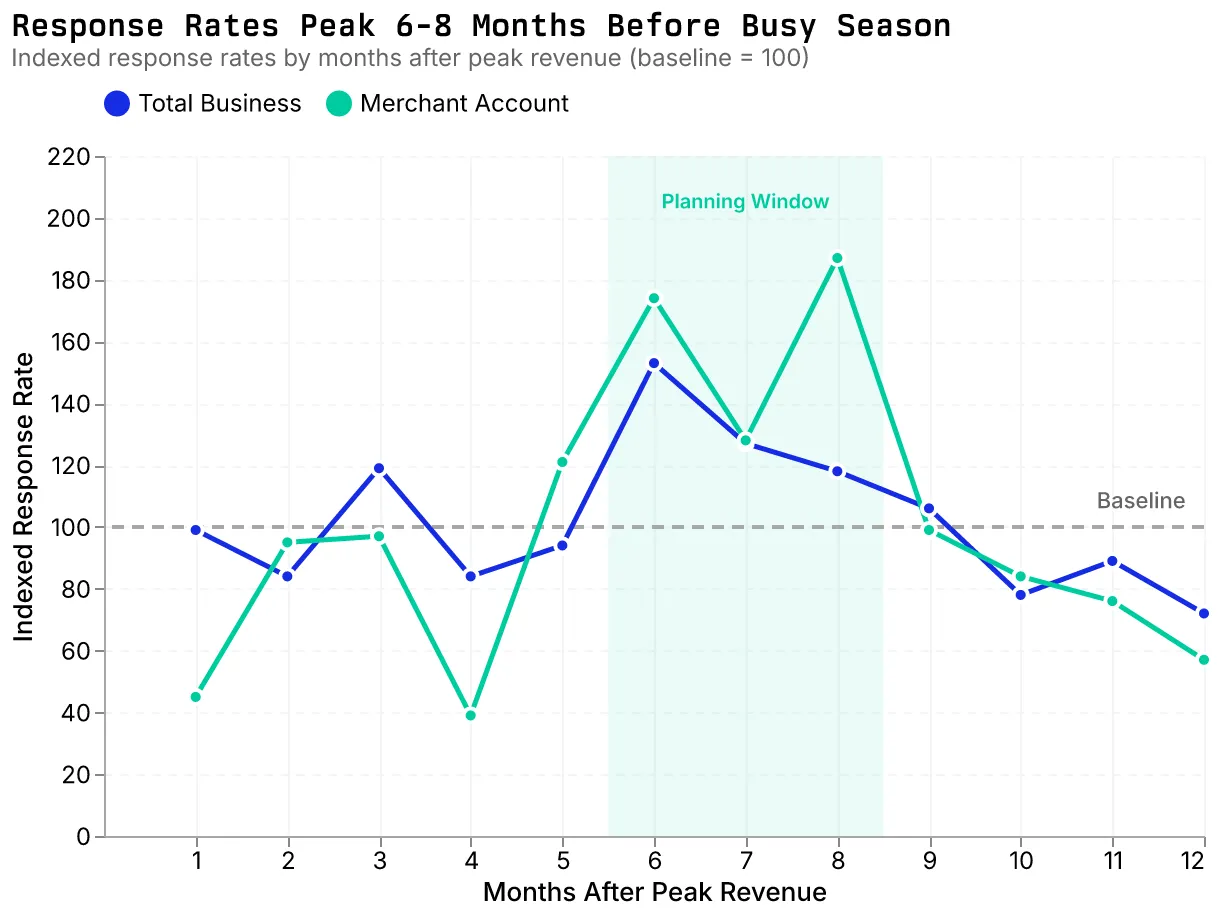
For merchant account campaigns, businesses contacted 6-8 months before their peak showed indexed response rates of 174-187 against a baseline of 100. Businesses contacted just after their peak (month 12) showed indexed rates of 57. That’s a 3x difference in response rates based purely on timing.
The pattern held for total business response as well: 153 indexed at 6 months versus 72 at 12 months. The mechanism is intuitive. Six months out, the upcoming season feels real enough to drive action but far enough to allow implementation. At 12 months, you’re pitching to someone who just finished their busy season and isn’t thinking about the next one yet.
Finding 2: Enigma Data Quality
In a recent performance review, our partner presented results across five regional banks comparing Enigma data against all other providers. The merchant services category showed a 297% lift for Enigma’s transaction-based dataset. Lending showed 346% lift.
But here’s what caught our attention: even Enigma’s marketable records, businesses flagged as active without full transaction history, outperformed legacy providers. The combination of transaction signals we use to determine marketability creates a baseline that beats what others consider their best data.
Why This Matters for Payments
If you’re selling merchant services, payment processing, or business banking products, you’re competing for attention with every other vendor trying to reach the same SMBs. Most are sending campaigns continuously, hoping to catch prospects at the right moment by chance.
The data suggests a different approach. Instead of constant nurture campaigns with mediocre engagement, concentrate your outreach on businesses entering their planning window. A landscaping company making equipment decisions in December for their May-September peak. A restaurant evaluating POS systems in January for their summer rush.
The lift compounds. Enigma’s core dataset already outperforms competitors by 297% for merchant services. Add temporal targeting on top of that, and you’re reaching better prospects at better times.
The Product: Peak Revenue Month as an Enrichable Attribute
Peak revenue month is now available through Enigma Enterprise, calculated from transaction data covering 40% of U.S. consumer credit and debit card volume. For each business identified as seasonal (approximately 214,000 entities at 87% precision), we provide:
Primary Peak Month: The calendar month showing highest transaction volume over the trailing 12 months.
Seasonality Score: How pronounced the seasonal pattern is. Strong peaks mean predictable planning windows.
Planning Window Indicators: Two derived fields, peakmonth-6month for strategic outreach and peakmonth-1month for urgency campaigns.
Unlike weekly triggers that catch immediate signals (new business formed this week), these are longer-range strategic triggers. The -6 month trigger identifies businesses entering their planning window; the -1 month trigger catches urgency as peak approaches.
Access these attributes via our GraphQL API for real-time campaign triggering, through bulk file enrichment to transform your prospect database, or via integration partners like Clay for automated workflows.
Getting Started
Peak revenue month data is available exclusively through Enigma Enterprise. Our team can help you identify which seasonal segments in your market show the strongest patterns and design an implementation approach that fits your campaign operations.
For payments companies, the combination of Enigma’s core data quality (297% lift for merchant services) plus strategic timing (response rates 2-3x higher when contacting businesses in their planning window versus just after peak) represents a fundamental advantage over competitors still sending batch-and-blast campaigns.
Contact our enterprise data team at enigma.com/contact-us or speak with your account representative about adding peak revenue month to your existing data package.
Peak revenue month calculations based on 214,000 U.S. businesses. Seasonality identification at 87% precision. Validated across 2023-2025 controlled testing across multiple regional banks.