Controlling for Bias: How We're Strengthening Our Card Revenue Estimates and Making Them Even More Accurate

When it comes to targeting business customers in sales and marketing campaigns, revenue is one of the most important segmenting dimensions. Knowing a company’s revenue, and how it’s trending over time, is a powerful indicator of whether the business will be a fit for your product/service — and is an important input in understanding a customer’s lifetime value.
But accurate revenue data is incredibly hard to procure, especially at the time of prospecting. In many situations, the industry defaults to the use of modeled revenue, which is largely inaccurate.
At Enigma, we take a different approach by providing our customers with the most accurate revenue data out there. Our estimates of companies’ card revenues are derived from actual transaction data from a panel of over 750 million active credit and debit cards, covering ~40% of credit card transactions in the United States.
Because our panel doesn’t cover 100% of transactions, we must apply a projection factor to estimate the total revenue, transaction counts, and customer counts for a given business.
We initially launched our product using a standard projection factor (a multiplier of 2.86*) in order to provide our customers with revenue data as quickly as possible:__
Card revenue Enigma sees x 2.86 = Total card revenue for a given business location
It’s always been our goal to create more sophisticated projection factors that account for biases in our panel. Now, we’re excited to announce our ability to adjust these projection factors to account for over- and underrepresented populations within the panel — and to calculate total card revenue more confidently than ever before.
Read on for the details of what’s changing, as well as what this means for Enigma customers.****
What is panel bias?
Every panel has bias, and it is nearly impossible to create a selection that is perfectly representative of the total population. What’s important when building a data product is to recognize that bias exists, and control for it.
For example, imagine if Enigma’s card panel had 50% of people in Town A, but only 33% of people in Town B. If Enigma applied a standard projection factor to transactions seen in the two towns, then the revenues of business in Town A may be systematically overestimated, and the revenues of businesses in Town B may be systematically underestimated.
The ideal outcome in this simple, hypothetical scenario would be to use a factor of 2 for Town A and a factor of 3 for Town B. ****
Strengthening our revenue calculation model and controlling bias
We no longer apply a single projection factor to all businesses, and now account for the following biases when determining the best projection factor to apply to transactions we see in our panel:
- Geographic bias
- Card type bias
- Income bias
- Size of purchases bias
We partnered with one of the largest US payment processors to evaluate our card revenue estimates against theirs. We found that our error rate decreased to 33%, an 8% improvement. We also found that our estimates lined up nearly 75% of the time when comparing Business A versus Business B in terms of card process volumes.
Below is a description of each type of bias that we are now adjusting for.**
Geographic Bias
We now control for where we have more cards in our panel in certain geographies over others. Examples include:
- LA is under-represented in our panel, so businesses in LA on average have a larger projection factor (3.4)
- Alaska is over-represented in our panel, so businesses in Alaska on average have a smaller factor (2.2) **
Card type bias
We see a larger percentage of consumer credit cards in the US than we see debit cards, EBT, HSA, or FSA cards. Therefore, business locations that heavily rely on these card types are now assigned a higher projection factor on average.
For example, grocery stores, which tend to see more EBT and debit card usage, now have an average projection factor of 3.2 (compared to a 2.9 average). Whereas electronics stores – where credit card usage is higher – now have an average projection factor of 2.6.**
Income bias
Lower income groups are underrepresented in our panel, in part due to their reliance on debit cards. So, on average, we’re applying a higher projection factor to businesses in zip codes with lower per capita income, and visa-versa. Examples include:
Lower income areas:
- Business locations in Columbus, GA (31903) have an average projection factor of 3.3, where the average household income is ~$29k
- Business locations in Detroit, MI (48208) have an average projection factor of 3.4, where the average household income is ~$28k
Higher income areas:
- Business locations in in Arlington, VA (22207) have an average projection factor of 2.5, where the average household income is $249K
- Business locations in St. Louis Park, MN (55424) have an average projection factor of 2.5, where the average household income is $249K**
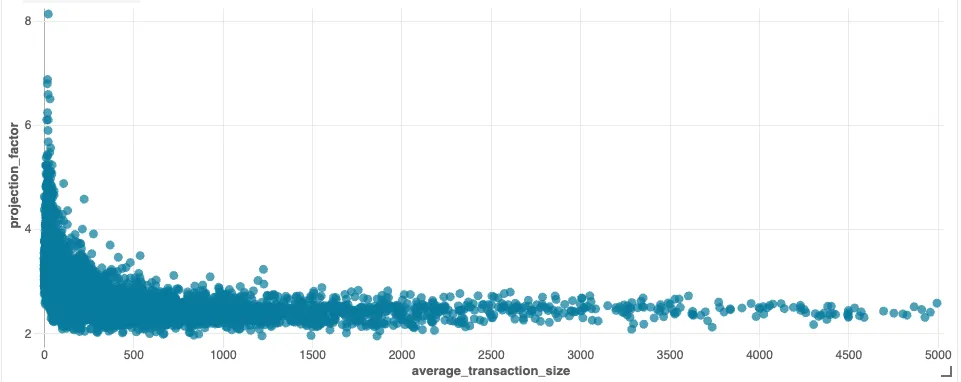
Size of purchases bias
We’ve seen that our coverage of transactions differs depending on the size of transactions, where we are more likely to cover larger transactions. This could be related to the aforementioned debit bias, so a business location that has a higher proportion of larger transactions will now get a lower projection factor, and visa-versa.
- Business locations with average transaction size < $20 have an average projection factor of 3.4
- This compares to business locations with an average transaction size >$500, which have a projection factor of 2.4
So, what does this mean for Enigma customers?
First and foremost, it means that the card revenue estimates you are receiving from Enigma have become more accurate: we believe they are about 8% more accurate than before. The same is true for transaction counts and customer counts.
These improvements are effective as of 12/1/23, and will automatically flow into your next data delivery or API calls. You do not need to do anything different to start receiving these improvements.
If there are businesses that you’ve been tracking over time, you may see some meaningful changes to the card revenue estimates. These changes are expected, and represent an improvement in the accuracy. You will not see any changes to growth rates based on these projection factor improvements, because the projection factors have been applied to all historical months in our time series.
You can also expect card revenue accuracy to continue to improve from here, given that we started with a conservative model that we will continue to expand upon.
Stay tuned for more updates and product improvements as we continue to deliver on our mission of providing the most accurate revenues for private businesses across the US.__
*This projection factor is derived by dividing the total credit and debit card transaction volume, according to the Fed, by the total transaction volume that Enigma sees.