Retail - San Francisco Retail Closure and Shoplifting Rates
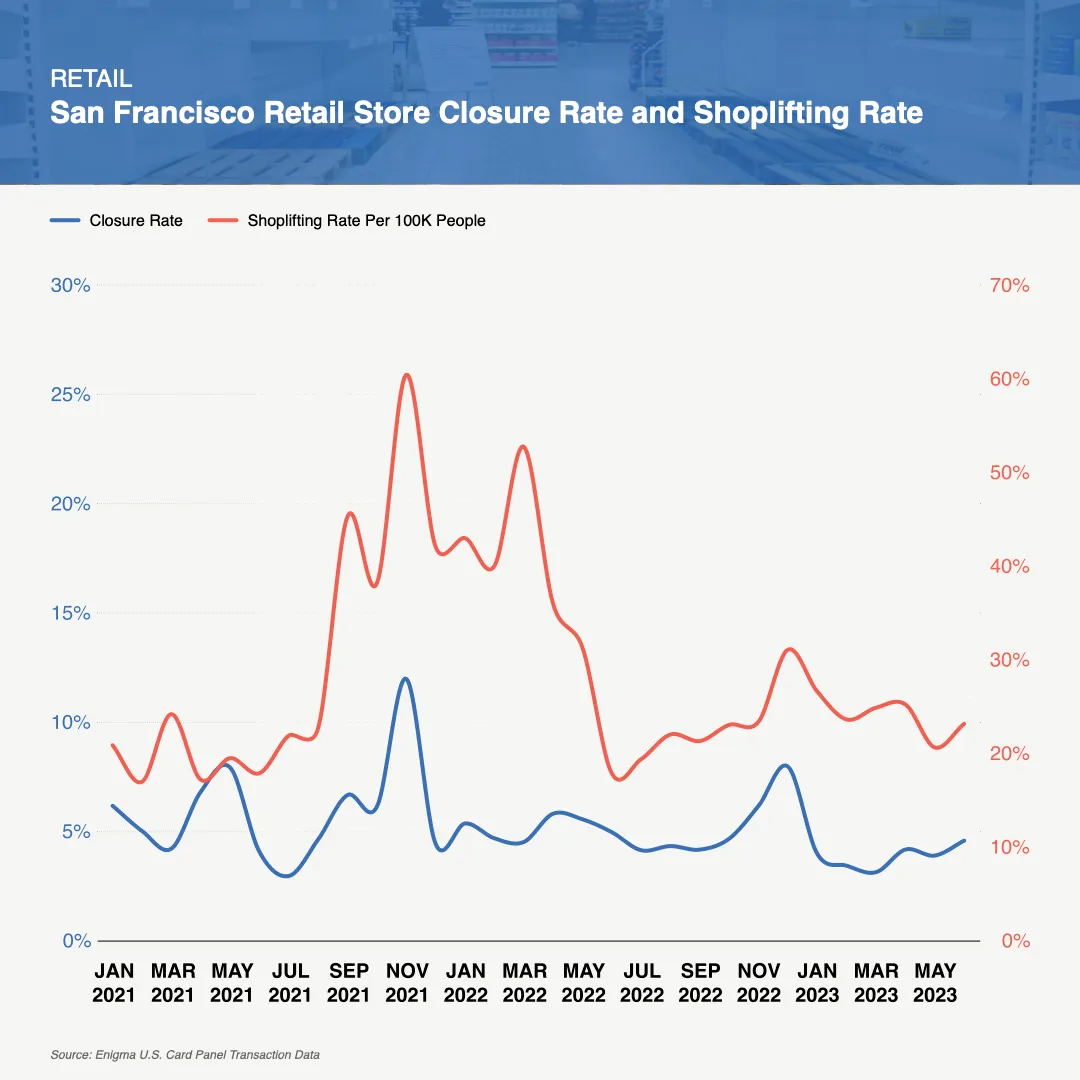
As shoplifting increases, store closure rates rise. Enigma’s data – tracking both store closures and openings – found peaks in closures in late 2021 and late 2022 in San Francisco. These closures follow a similar pattern to the Council on Criminal Justice’s shoplifting data in San Francisco.
In November 2021, for example, store closure rates doubled month-over-moth while shoplifting increased from 38% to 60%. In December 2021, however, both closures and shoplifting significantly decreased to 4% and 42%, respectively.
Enigma’s data can help you learn more about the businesses that are opening and closing in the industries you care about and can be used alongside other data sets -- like the Council on Criminal Justice’s shoplifting data -- to help you get a better picture of a business, industry, or city.