Public Schools Middle School Attendance Boundaries
Geographic attendance boundaries are included for the 22 middle schools in the Chicago Public Schools district that have them for the 2024-2025 school year. Each record includes the school's unique identifier, name, and the polygonal shape of its designated attendance area.
| School Namebrand | School IDregistration | School Yeartemporal | Grades Servedclassification | Community Areageographic | Geometry Typegeospatial |
|---|---|---|---|---|---|
| Alcott College Prep | 610513 | 2024-2025 | 6-8 | Lincoln Square | Polygon |
| Chalmers Elementary School of Excellence | 610265 | 2024-2025 | 6-8 | Austin | Polygon |
| Robeson High School | 609728 | 2024-2025 | 6-8 | Englewood | Polygon |
Retail Site Selection Near School Zones
A retail chain evaluating locations for after-school-focused stores, such as tutoring centers or youth apparel, overlays middle school attendance boundaries against candidate storefronts to estimate the density of households with school-age children within each catchment area before committing to a lease.
Residential Insurance Territory Calibration
A property insurer refining neighborhood-level risk tiers uses school attendance boundaries as a proxy for stable residential micro-zones, cross-referencing community area designations with claims history to test whether boundary-defined areas correlate with loss ratios more precisely than ZIP codes alone.
EdTech Market Sizing by Catchment Area
An EdTech company selling supplemental learning tools to families estimates its addressable market in Chicago by counting the number of distinct middle school attendance zones, identifying which community areas they cover, and prioritizing outreach to zones with the highest estimated household density.
 Public Schools High School Attendance BoundariesCity of Chicago
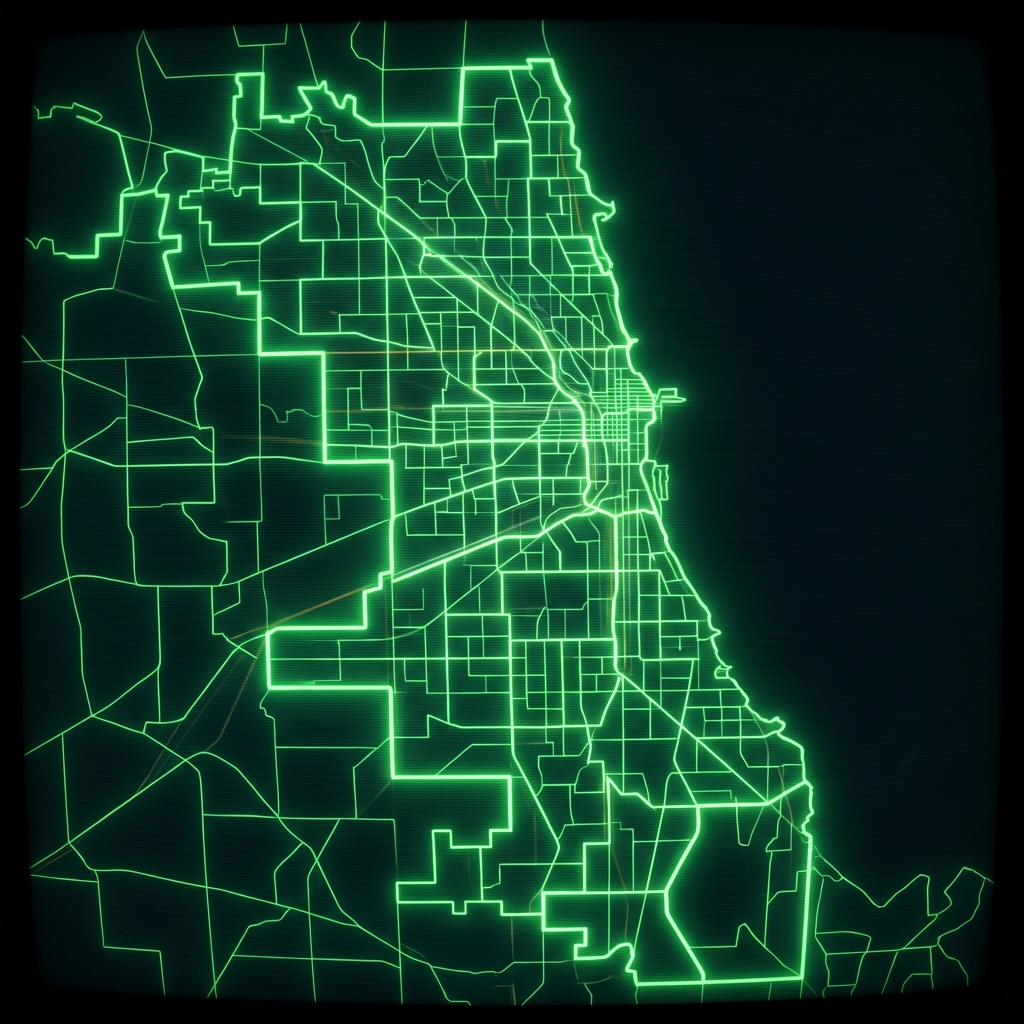 Public Schools Elementary Attendance BoundariesCity of Chicago
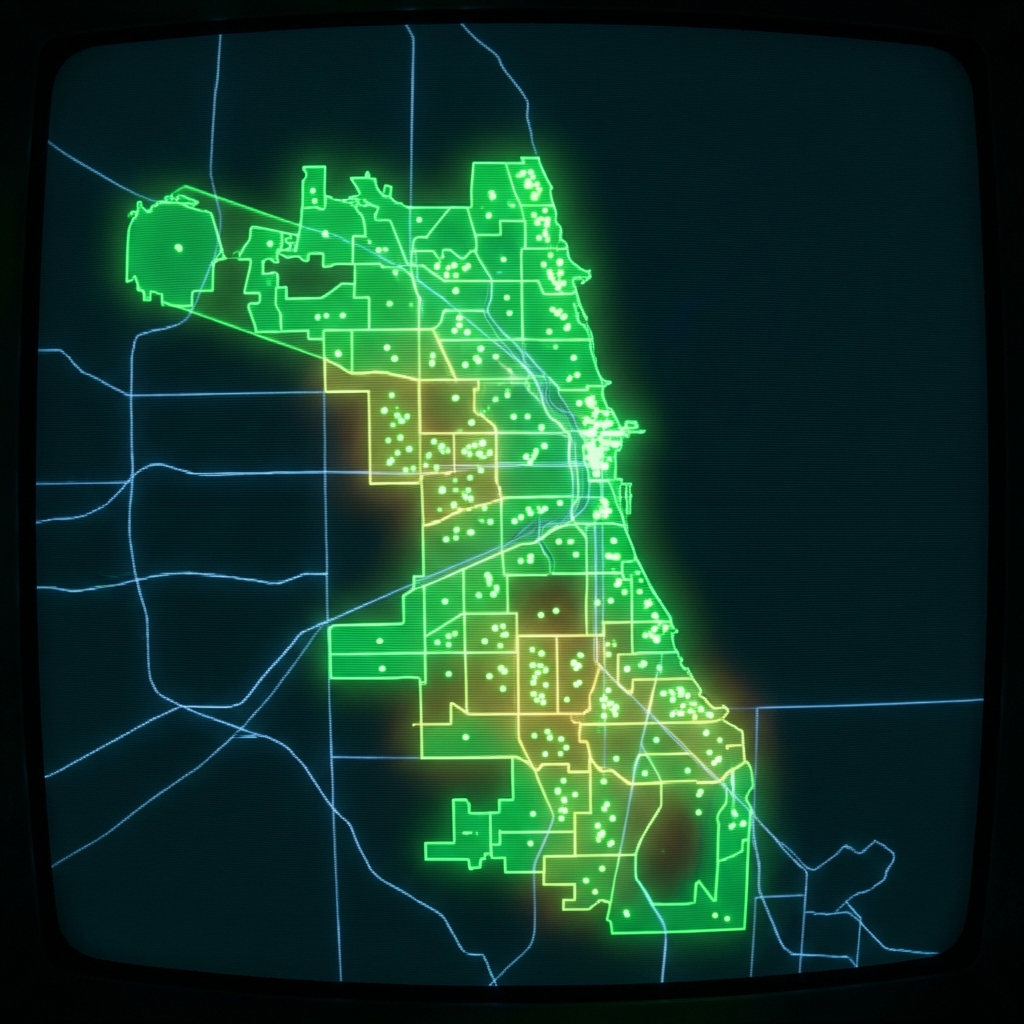 Charter School BoundariesCity of Chicago
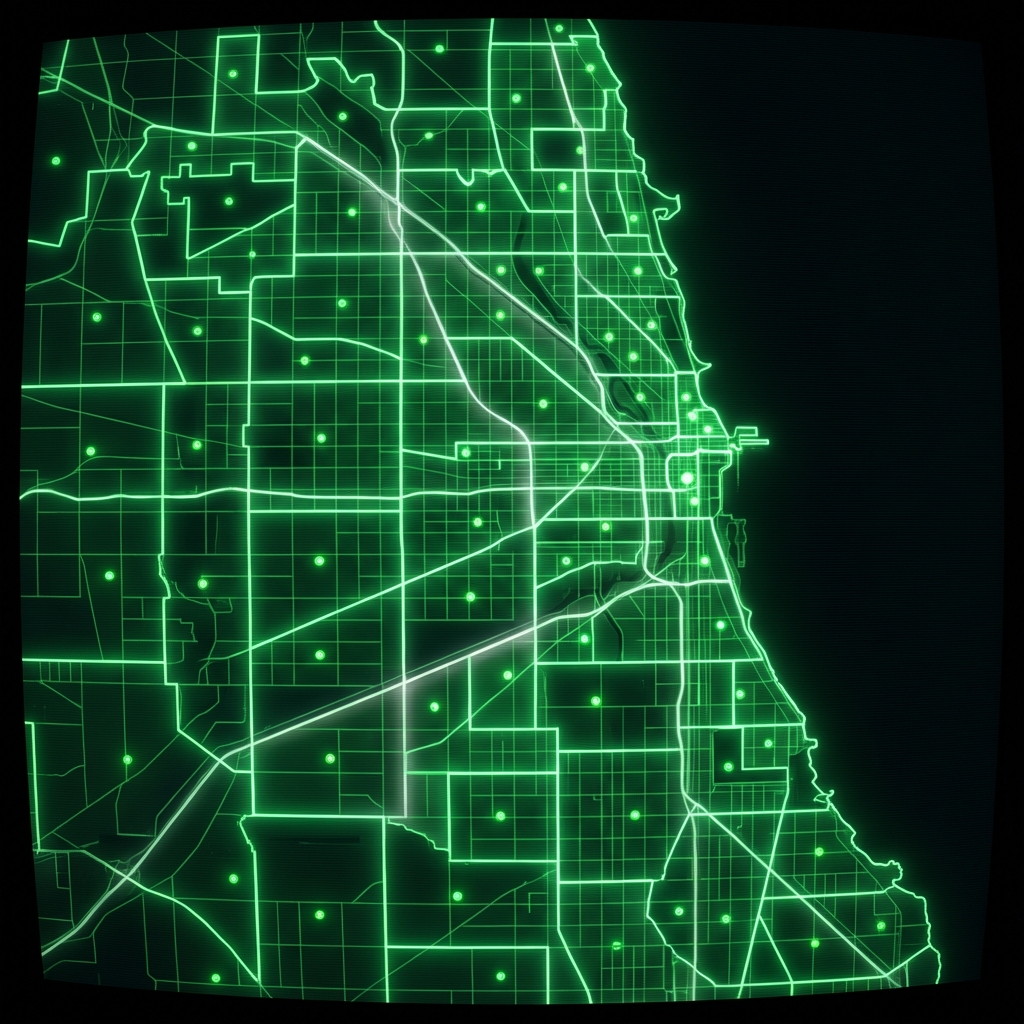 Elementary Attendance BoundariesCity of Chicago
 High School Attendance BoundariesCity of Chicago
 Public Schools Charter School Preference BoundariesCity of Chicago
 Elementary School Attendance BoundariesCity of Chicago
 Charter School Preference BoundariesCity of Chicago
 Chicago Public Schools - School Locations
 Charter School Preference BoundariesCity of Chicago
 cpsschoollocationssy1415
 cpsschoollocations1617
 Public School AdmissionsCity of Chicago
 Schools (deprecated 2012)City of Chicago
 Public Schools - School Progress ReportsCity of Chicago
 School LocationsCity of New York
 Public School ProfilesCity of Chicago
 Public Health Clinic LocationsCity of Chicago
 Community Service CentersCity of Chicago
 Elementary Schools, by Top to Bottom PercentileCity of Ferndale, Michigan